Supply curves are critical for procurement strategy and capital planning, offering a powerful tool for professionals studying markets and charting strategy. However, accurate supply curves for recycled fiber in the US have been unavailable to procurement professionals – until now.
Last month, we launched Recycled Fiber 360 – our new pricing benchmark that provides exponentially better pricing data on the US recycled paper market. Unlike other indices that rely on a limited number of interviews and anecdotes, Recycled Fiber 360 utilizes transaction-based data. Last month, our system contained nearly 10,000 discrete transactions of various volumes across the US, a number that will continue to grow as we onboard more companies.
Utilizing big data sets unlocks powerful analysis for professionals in OCC markets. Pros can analyze prices by geography and by spot versus contract, benchmark their mills, and now study the shape of the fiber supply curve.
While it is common to refer to average market prices, strategists, and procurement professionals know that businesses often live and die by the margins. Using averages can lead to average decision making at best. Let’s see how.
In Figure 1, we can see the dramatic fall in delivered #11 OCC prices since their peak in Q4 of 2021. Although Recycled360 users can remove freight and evaluate fiber-only prices, we will continue our analysis with the delivered cost basis. In November of 2021, US Average #11 OCC spot prices delivered were $230/st. A year later, prices have fallen to less than $100 for the average US mill.
Figure 1: US #11 Delivered Prices, FOB Mill
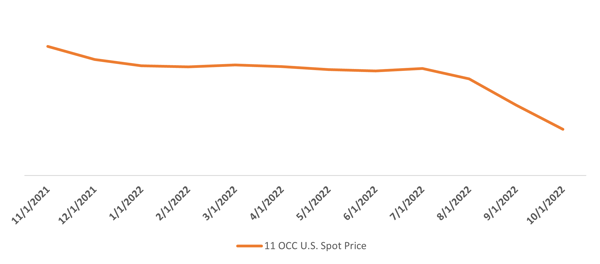
Source: Recycled Fiber 360
When analyzing the US average supply curve, we can see the big picture of the market becomes more nuanced. Figure 2 illustrates the US #11 OCC supply curve in October, which shows that market prices are anything but average. The x-axis shows the percentage of volume in the market, with the y-axis showing the average prices of volume transacted at that volume tranche. We can see that our “average price” falls at about the 60% line of the volume in the market. The slope of this curve defines the incremental volumes available with increasing price – a critical concept in economics called elasticity. This is crucial to know and understand because analysis of marginal prices in markets provides a powerful tool for strategic planners and procurement professionals.
Figure 2: The US #11 OCC Fiber Supply Curve
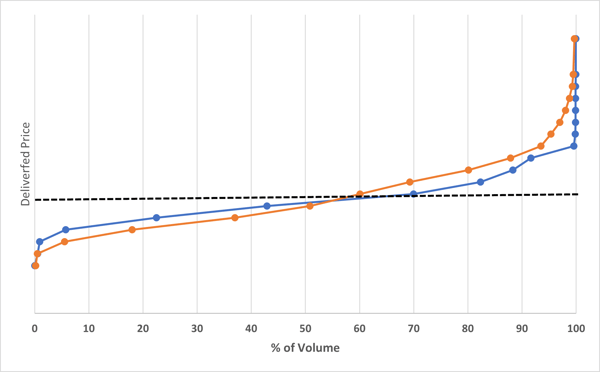
Source: Recycled Fiber 360
As expected in soft markets, we can also see spot prices appear to be lower than contracted prices for OCC (when markets turn, economic theory tells us that higher spot prices are a leading indicator of a tightening market). We can also see that marginal prices, those traded in the 90th percentile and higher, are well above the lower quartile and almost $25/st above the average price in the market.
When evaluating choices, professionals often need to look at the marginal impact of their choices – for example:
- When evaluating a machine debottlenecking project, should we use average OCC prices or marginal prices? (The correct answer is marginal, in keeping with the “with or without” principle of planning).
- If we stopped buying in the market, what’s the impact to profitability? (It’s lower than if your accountants are using average OCC prices).
- What is the market clearing price? This is critical if you’re considering how the industry might evolve in the future or if you’re deciding on whether to build a new mill or convert an existing mill that utilizes large quantities of recycled furnish, like containerboard.
- How competitive is our marginal ton of linerboard production compared to competitors in other regions? Are we better off taking orders or downtime considering marginal costs?
- What happens to margins if we utilize more alternative furnish?
For further insight into how Recycled Fiber 360 can help you answer the questions above, download the white paper below or talk to a Fisher International representative today to arrange a demo.