Quality data is fundamental for pulp and paper professionals when it comes to gleaning information about competitors, customers, and the marketplace, but how it is utilized in analyses and decision-making makes it transformational to a business’ success. And, while decisions made based more on intuition and judgement do not necessarily lead to disaster, they do leave money on the table in the form of less-than-ideal pricing, lost sales, and other missed opportunities.
On the other hand, companies that use data-driven analytics well to inform their decision-making, consistently outperform their competitors. These companies benefit from the ability to anticipate market changes and manage to steer the business in challenging times. They know what’s working and where the risks are. They optimize for costs and efficiencies. And they improve their decisions, both the strategic and the everyday, over time. As a result, they see improvement in revenue, asset utilization, and other financial indicators.
We’ve seen this come to fruition in the pulp and paper industry numerous times over the last several years, from new paper machines built or converted only to find the market had fallen out in that region to mills purchased that remain or became idled shortly thereafter. But we have seen many successful rebuilds, starts, and restarts of paper machines and mills in the last several years, too. The difference between failure and success can be traced to both the use of market intelligence and how it was analyzed.
With tight profit margins, cost reduction and pricing pressures, and shrinking lists of competitors in today’s pulp and paper industry, what’s left as a basis for competition is executing with maximum efficiency and effectiveness and making the smartest decisions possible. We have seen the shifts to make better use of data in analytics on the manufacturing floor and in the supply chain. Optimization of inventory levels and placement, particularly for commodity products, and of grade transitions come to mind. And we have also seen shifts in maintenance practices, moving to preventative and now predictive maintenance, with the goal of avoiding unscheduled downtime while controlling costs.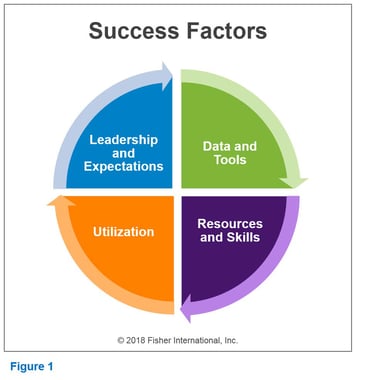
Other areas of the business have been lagging in their use of advanced analytics. You may find that surprising, as you look around at all the reports you have available and the Excel spreadsheets you reference. The questions become the following: How is the data being used, when is it being used, and for what? In our experience, and based on our research, we find the answers to these questions reflect basic to mid-level use of business intelligence in most areas compared to what it could be.
So now that the data and information is available, how can we put it to better use to become the better performers and lead our competition? We here at Fisher have identified these four success factors: Leadership and Expectations, Data and Tools, Skills and Resources, and Utilization (Figure 1).
Let’s look at each of these a little more closely, along with some practical examples.
Leadership and Expectations
Leadership is key in establishing an analytical culture within an organization. Without it, the use of data and data-driven decision-making will be based on what individuals value, what they believe to be worthwhile for the effort, and will be limited to what analytical skills they each have.
In leading analytical companies, senior managers identify target processes to which analytics and data-driven decision-making will be applied. The targets chosen should support the company’s key goals and strategies. To paraphrase the saying, “Don’t try to do it all because you won’t do any of it well.” Rather, identify the key capabilities or services which distinguish your organization from your competitors and make them the priority.

These may be sales related – being prescriptive in identifying the profitable customers, the loyal customers, even the customers at risk, and optimizing pricing for products or services, particularly for non-commodity items – to drive revenue. These may be customer-focused – improving reliability and performance, which improves sales and margins, or bundling services with products to grow customer loyalty. Or, they may fall in other areas, such as supply chain optimization for commodity products, asset optimization, market strategies, and so forth.
Once the targets are established, share the expectations around these targets and move forward from there. Knowing what the goals are will also help identify the gaps in the data available and develop a focused strategy to improve the data sets, the tools for storing and using it, and the resources needed.
Senior managers also have a passion for managing by fact, and they do not take proposals or reports at face-value. Rather, they ask tough, probing questions to question the analytics used to ensure the expected processes, data, and methods were used to gain the results presented. Like a good investigative reporter, “What”, “Why”, and “How” are the start of many of those questions: Why are the trends going in that direction? Now what? What will the results be if…? How do we make a change in course? And so on. As Ronald Reagan said, “Trust but verify.”
Data and Tools
Data, and the tools to analyze and use it, is fundamental, as we mentioned at the beginning. Data that is not readily available, accessible, or easy to use will not be used, especially when everyone is already busy. Time needed to combine data from different sources, clean it and align it, correct data quality issues, and the like will not happen. The data that is easy to utilize – experience and intuition, or individual pieces of information – becomes what people fall back on instead; thus, also limiting the quality of the insights gleaned and the decisions made.
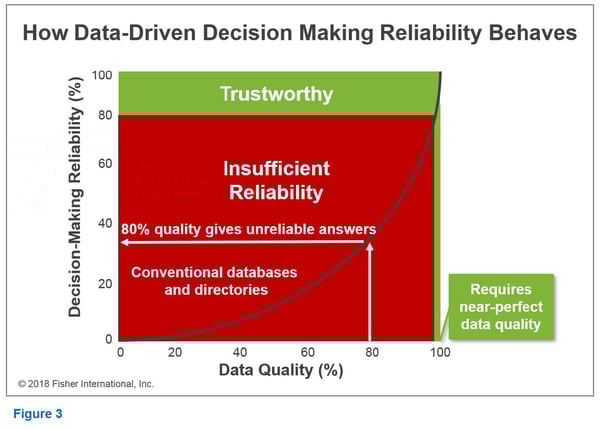
It is important, then, for the data that is available – internal and external business intelligence, plus other sources – to also become the data that is easy to utilize through data standards (to ensure clean, quality data) and integration. And the more data that can be sourced from systems, rather than people and manual entry, the higher the quality of data, as seen in Figures 2 and 3 below.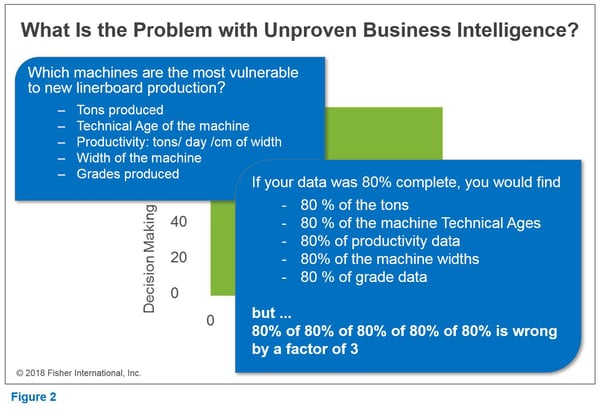
 The other key here is tools or systems that will allow for more than basic queries and reporting of the data. Successful companies have an analytical platform that brings all the data sources together into one place and provides the tools which allow anyone to perform advanced analyses.
This data integration allows for better and more thorough analyses, since information can now be more easily joined, such as sales and cost information, claims information, customer details, and other product specifics. From visualization of the data, such as scatterplots and histograms, to the creation and application of models, the tools need to be embedded in everyday use to generate insights and context.
Not only can you see what products have better margins, for example, but you can also find out what your market share of those products are versus your competitors’ shares, what types of customers have better pricing and margins than others, which quotes became sales orders and which did not and why, which customers are coming up on reorder points, and so on. You can also identify trends in areas of your market; determine which are challenged, which are growing, and why; and readjust the focus accordingly.
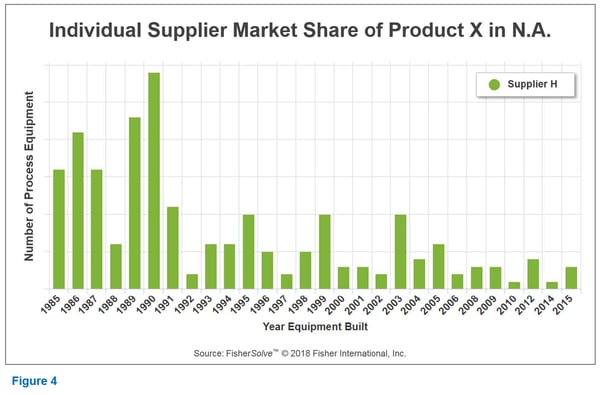
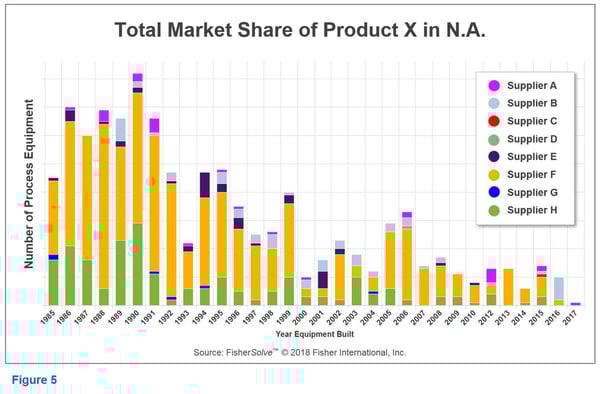
For example, let’s say we are a supplier of refiners used in Stock Prep applications. We can start by looking at our own market share in North American mills over the last 32 years to see how it has changed (Figure 4). We can then drill out a level to see how our market share compares to our competitors over the same timeframe (Figure 5), and we can see that we have been losing share.
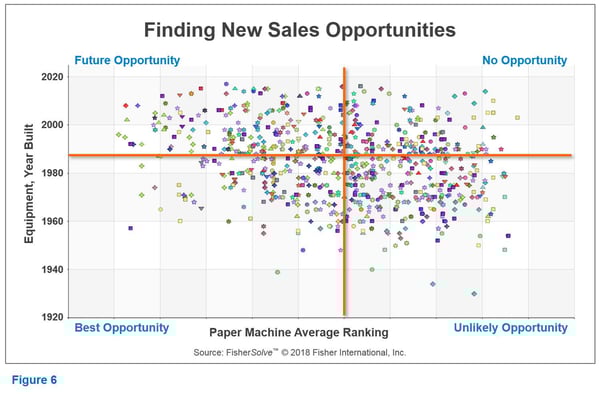
 However, thanks to the data we have available, we can do some additional analytics to find those mills that are most likely to do replacements or rebuilds of their refiners (Figure 6), allowing us to start building sales plans to target those opportunities.
With other integrated data, such as sales data and financials, plus market intelligence information, we can go on to do further analyses that will allow us to build cost-benefit information and establish optimal pricing for those mill proposals
Resources and Skills
Now that the data and tools are in place, there must be resources and skills for using them. Leading companies have dedicated analysts tasked with performing the more sophisticated analyses, finding the trends and correlations, and building and maintaining models. They also support the businesspeople at large in their use and application of analytics.
As the analytical culture matures and analytics use becomes more widespread, the analysts move into continuously improving the models and decision-making processes. They also promote and spread best practices and build collaboration around the organization – why reinvent the wheel when another area is already doing it well?
For those companies starting out on the path to make better use of analytics in decision-making, the benefit of the analyst role is this: a few people, performing analytics for the group, will bring results more quickly than waiting for everyone in the organization to be trained and build their skills around their other responsibilities. These analysts will be focused on data quality, data integration, standardization, and providing information that meets the defined targets and expectations. And people with the necessary skills, or nearly so, probably already exist in the organization.
Utilization
Utilization is as fundamental as data and tools. The goal is for the right people to have the right information in the right context at the right time to make the right decision.
To evaluate how well business intelligence is being utilized, simply look at how it is being utilized (Figure 7), in what formats, and to answer what kinds of questions. Companies that are primarily looking up information as needed, such as mill information or contacts, or are using reporting, such as financial or sales reports, are not getting the value out of the data that they could be. In our experience, we have found that 80% of companies use business intelligence for look-up functions.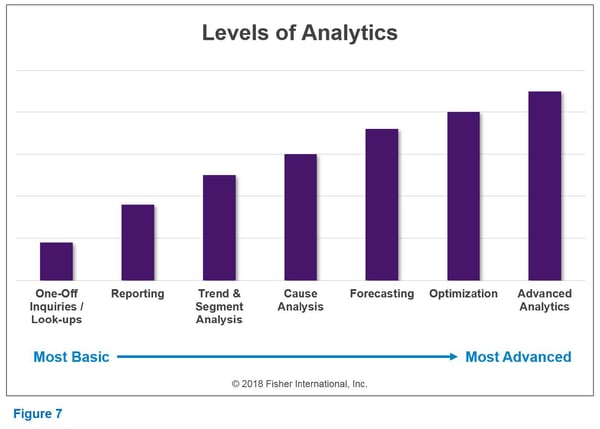
Identifying trends and root-cause analysis work are past- and present-looking and are the first steps in advancing with data and analytics. These uses certainly have value, including identifying areas of change, improving quality to reduce claims, or improving quote-to-sales order percentages. However, it is important to not look only at the past, as “what’s past is past and can’t be fixed.
Forecasting, optimization, and advanced analytics (use of models and insights) are future-looking. These are where the analytic leaders glean the most value from their business intelligence. They can better predict what will be happening and can more quickly adjust and adapt to customer and market changes. Those of us familiar with the coated and supercalendered grades can certainly come up with examples of those companies that had the insight, adjusted strategy, and exited those markets versus those that did not and have struggled or even closed as a result.
Identifying which customers are at risk and why, where capacity is being added or rebuilds are likely to happen, identifying who will likely benefit the most from a product and why, or performing what-if scenarios are just a few examples. Yet, less than 10% of companies we’ve worked with were initially using business intelligence in these ways. Which also means that it would not take much to lead the way.
As we saw in the diagram in Figure 1, the success factors are circular. It is a continual evolution, and companies don’t become strongly analytical all at once. The key is to start somewhere – pick a few key decisions or the everyday, recurring ones (since these often have lots of data available), ask the questions, and apply data-driven decision-making to them. From there, always be thinking about how to
become more analytical and data-driven in the decision-making. Add the next layer and keep moving forward. Monitor key metrics to ensure performance improvements are being realized.
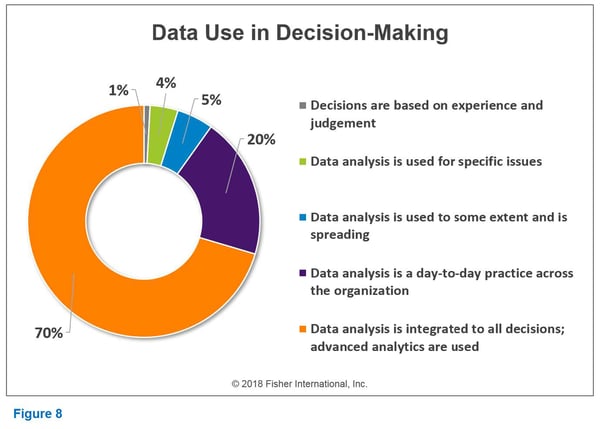
As more knowledge is gained from analytics with business intelligence, the more often intuition and gut reaction can be replaced with facts and insights to make smarter decisions in a timely manner (Figure 8).
 Companies, including those in the pulp and paper industry, have gotten good at collecting the data and other business intelligence. Now it is time to put them to use, since analytics and fact-based decision-making are the new normal. Those who do so with intent and make it a priority will be the ones who get ahead of the rest.
 Joanna Wilhelm has more than 20 years of paper industry experience and brings exceptional project management and operational leadership skills to her position as a Senior Consultant. Her experience in providing project management guidance and leadership for cross-functional and cross-division projects makes her a strong asset to the Fisher team. She balances diverse competencies including manufacturing processes, audit and metrics tracking, needs assessment, training, and team-building with a keen ability to meet or exceed budget and cost-saving goals on the various projects with which she is involved.