Mexico is the 10th most populated country globally with a relatively young and growing population. Its urban population accounts for 81.3% of the total, and about 30% of the population is concentrated around Mexico City. Mexico's $2.4 trillion economy is ranked 11th in the world. In addition, the renewed North American Free Trade Agreement with Canada and the United States provides Mexican manufacturing opportunities and a bridge between Latin American culture and the Anglo cultures within the north. Ultimately, it is these factors that provide a solid basis for consumer tissue consumption.
However, Mexico's location on the long southern border with the United States also creates problems regarding drug trafficking cartels and violence as illegal products move from South America to the world's largest economy. The cash that is associated with the cartels ultimately ends up supporting government corruption. In addition, Mexico also has its southern border issue with drugs and refugees coming from Central and South America. These complications tend to reduce the potential of the Mexican people and economy to support tissue manufacturing.
Mexico's population grew by about 1.04% in 2021. Figure 1 shows the population growth trend as bars. The country’s gross domestic product per capita is shown as the blue line on the same figure. This is an adjusted GDP per capita based on purchasing power parity to enable global comparisons. The strong GDP growth with a moderately growing and young population should support domestic tissue demand growth.
Figure 1: Mexico GDP per Capita and Population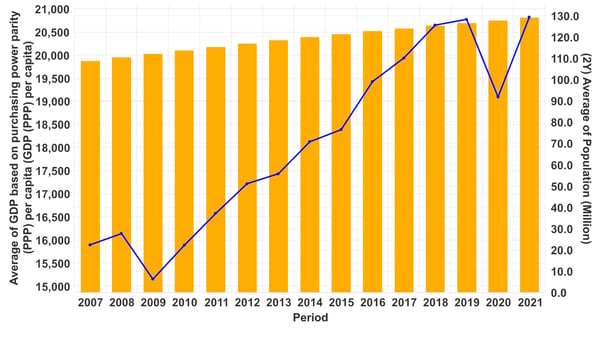
Source: FisherSolve
The country’s consumer price inflation and unemployment are shown in Figure 2. The bar graph shows the unemployment rate trend, which has been decreasing up until 2021. However, underemployment may be as high as 25%, which would be a drag on consumer tissue demand. The inflation rate has shown significant volatility and appears to be climbing as of the end of 2021.
Figure 2: Mexico Consumer Price Inflation and Unemployment
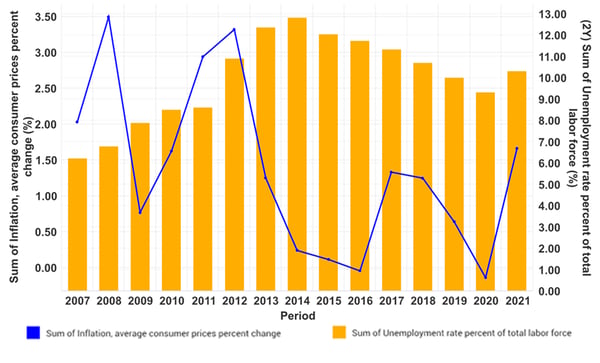
Source: FisherSolve
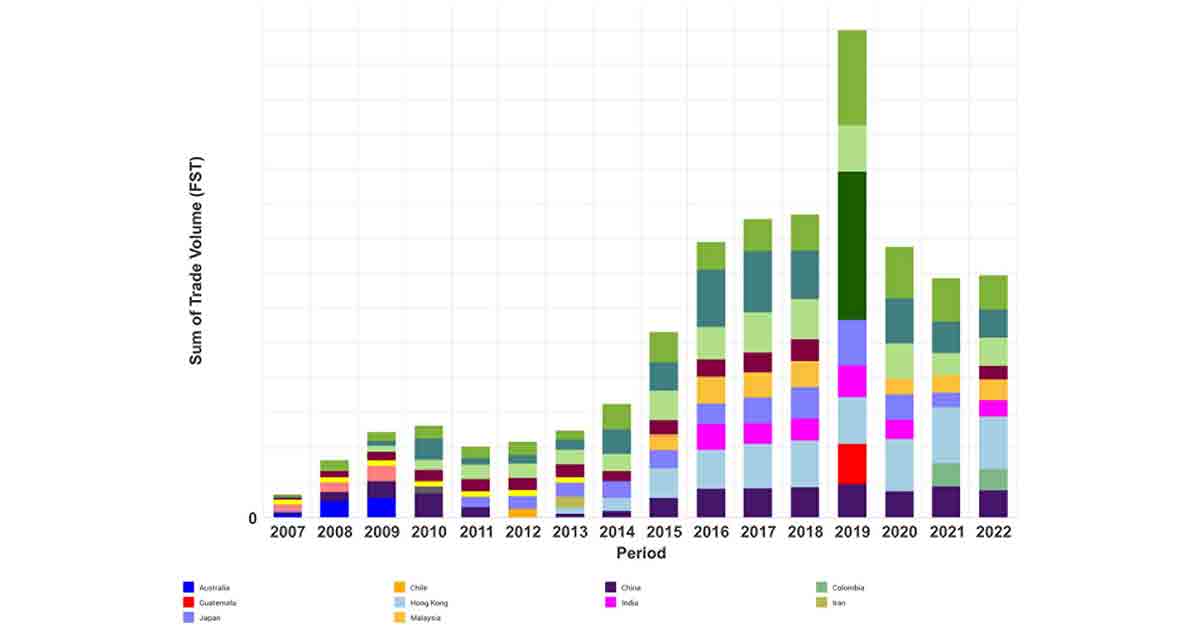
Mexico is a net tissue exporter, as shown in the subsequent two figures. Figure 3 shows the growth of Mexico's tissue exports have tripled since 2007 – and the United States accounts for almost all of this growth and total volume. Other tissue customers include Canada, Chile, Costa Rica, El Salvador, Nicaragua, and Puerto Rico.
Figure 3: Mexico Tissue Exports
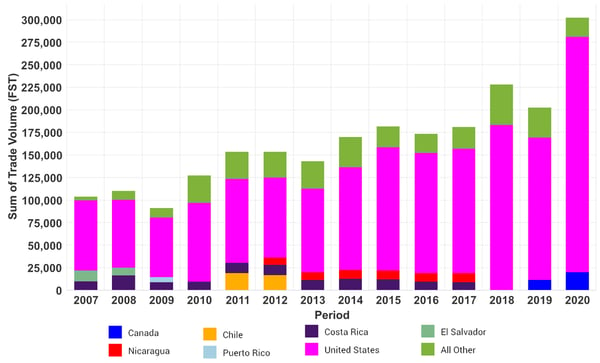
Source: FisherSolve
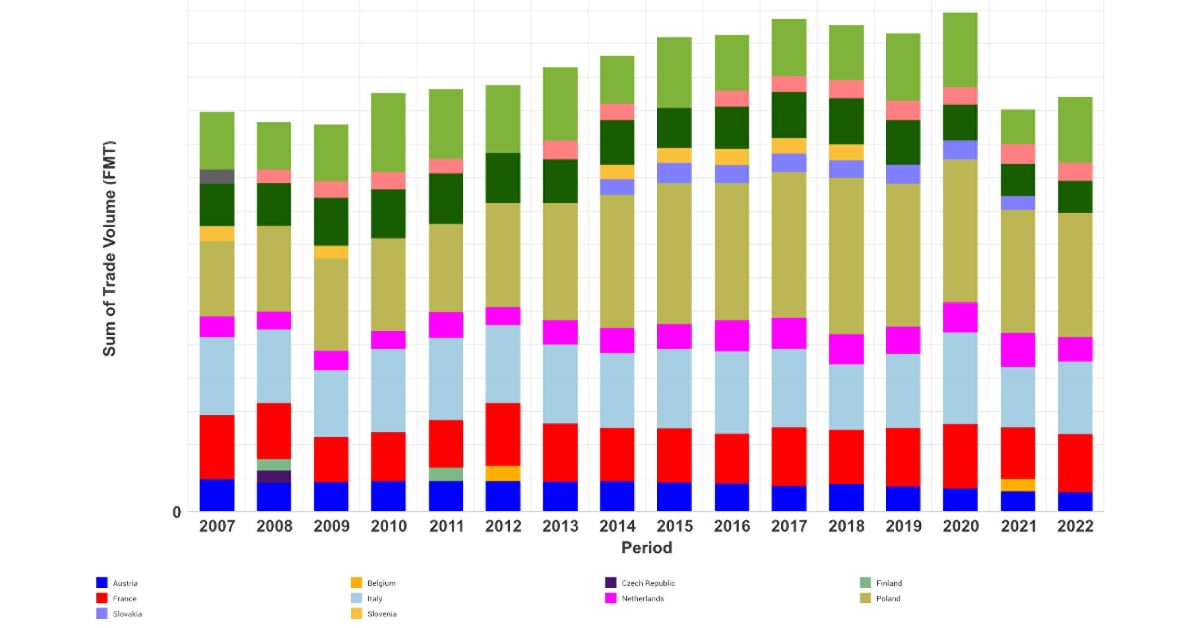
Tissue imports are shown in Figure 4. Again, the United States is the largest tissue supplier to Mexico, with other imports coming from Canada, Chile, China, Colombia, Indonesia, Peru, Turkey, and the United Kingdom. Mexico's tissue imports tend to run at about 1/3 of 2020 tissue exports, as shown in Figure 3 and 4. This indicates that Mexico intends to remain a net tissue exporter and that production capacity has not been added too quickly.
Figure 4: Mexico Tissue Imports
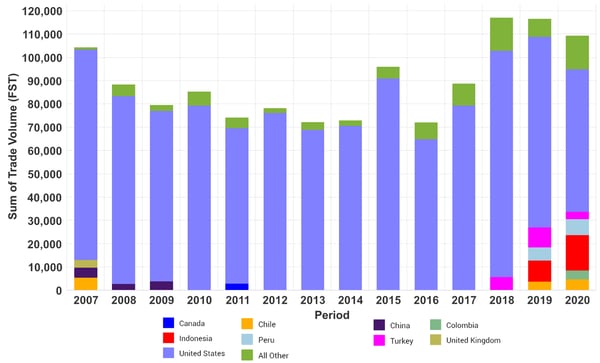
Source: FisherSolve
Figure 5 shows the tissue machine additions and deletions trend and as we can see, 16 new machines were added while seven shut down over the chart period. This indicates good discipline in managing the tissue fleet. However, each new machine generally represents a significant capacity increase compared to the removed machines.
Figure 5: Mexico Tissue Machine Additions and Deletions
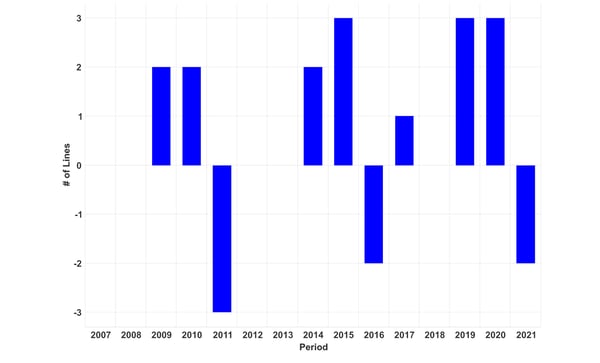
Source: FisherSolve
Mexico tissue makers use mostly recycled bleached fibers as shown in Figure 6. Other components include unbleached pulp substitutions and unbleached papers that are not deinked, Kraft eucalyptus bleached pulp, Kraft southern softwood, and Kraft bleached nonwood short fiber. The nonwood fiber would include crop residues such as bagasse from sugar cane.
Figure 6: Mexico Tissue Fiber Sources
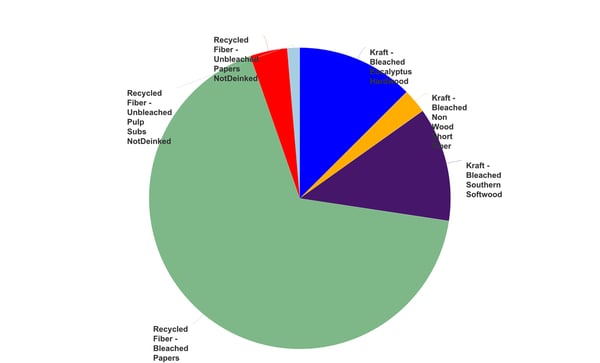
Source: FisherSolve
Mexico's tissue production is focused on consumer bath, as shown in Figure 7. Consumer towels and consumer napkins are the other largest segments. Commercial bath tissue, napkins, and towels are somewhat smaller sectors compared to the United States or Canada.
Figure 7: Mexico Tissue Products
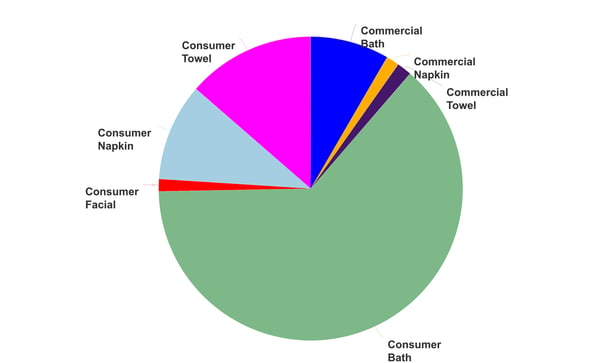
Source: FisherSolve
Mexico has long had several tissue machines with TAD processes but has added new advanced tissue capacity within the past 15 years. Figure 8 shows the relative proportion of advanced technology today at less than 15%. This includes TAD and non-TAD textured and structured tissue technology, making premium and higher-margin products for domestic and export needs. This sector is expected to grow as the proportion of US advanced tissue products increases.
Figure 8: Mexico Tissue Machine Process
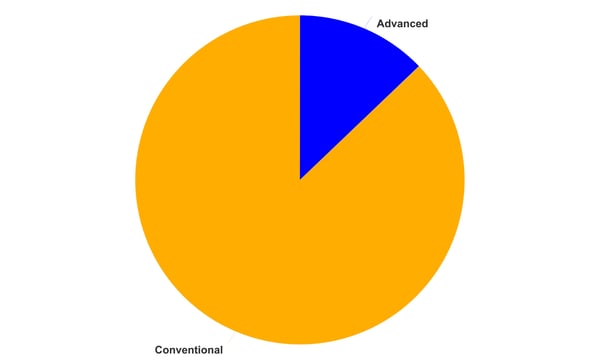
Source: FisherSolve
Mexico's advanced tissue capacity is overwhelmingly focused on consumer bath tissue, as shown in Figure 9. The proportion of consumer towels produced with advanced technology is much lower than expected. Still, it shows the difference in total consumer towel consumption in Mexico versus the US and Canada. This is the main difference in Mexico's tissue consumer habits compared to the rest of North America. However, it is more in line with Latin American consumer behavior.
Figure 9: Mexico Advanced Tissue Products
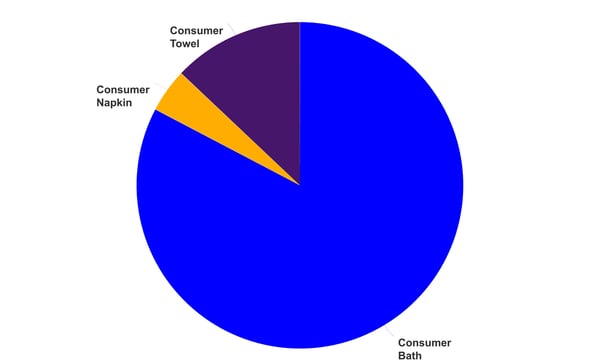
Source: FisherSolve
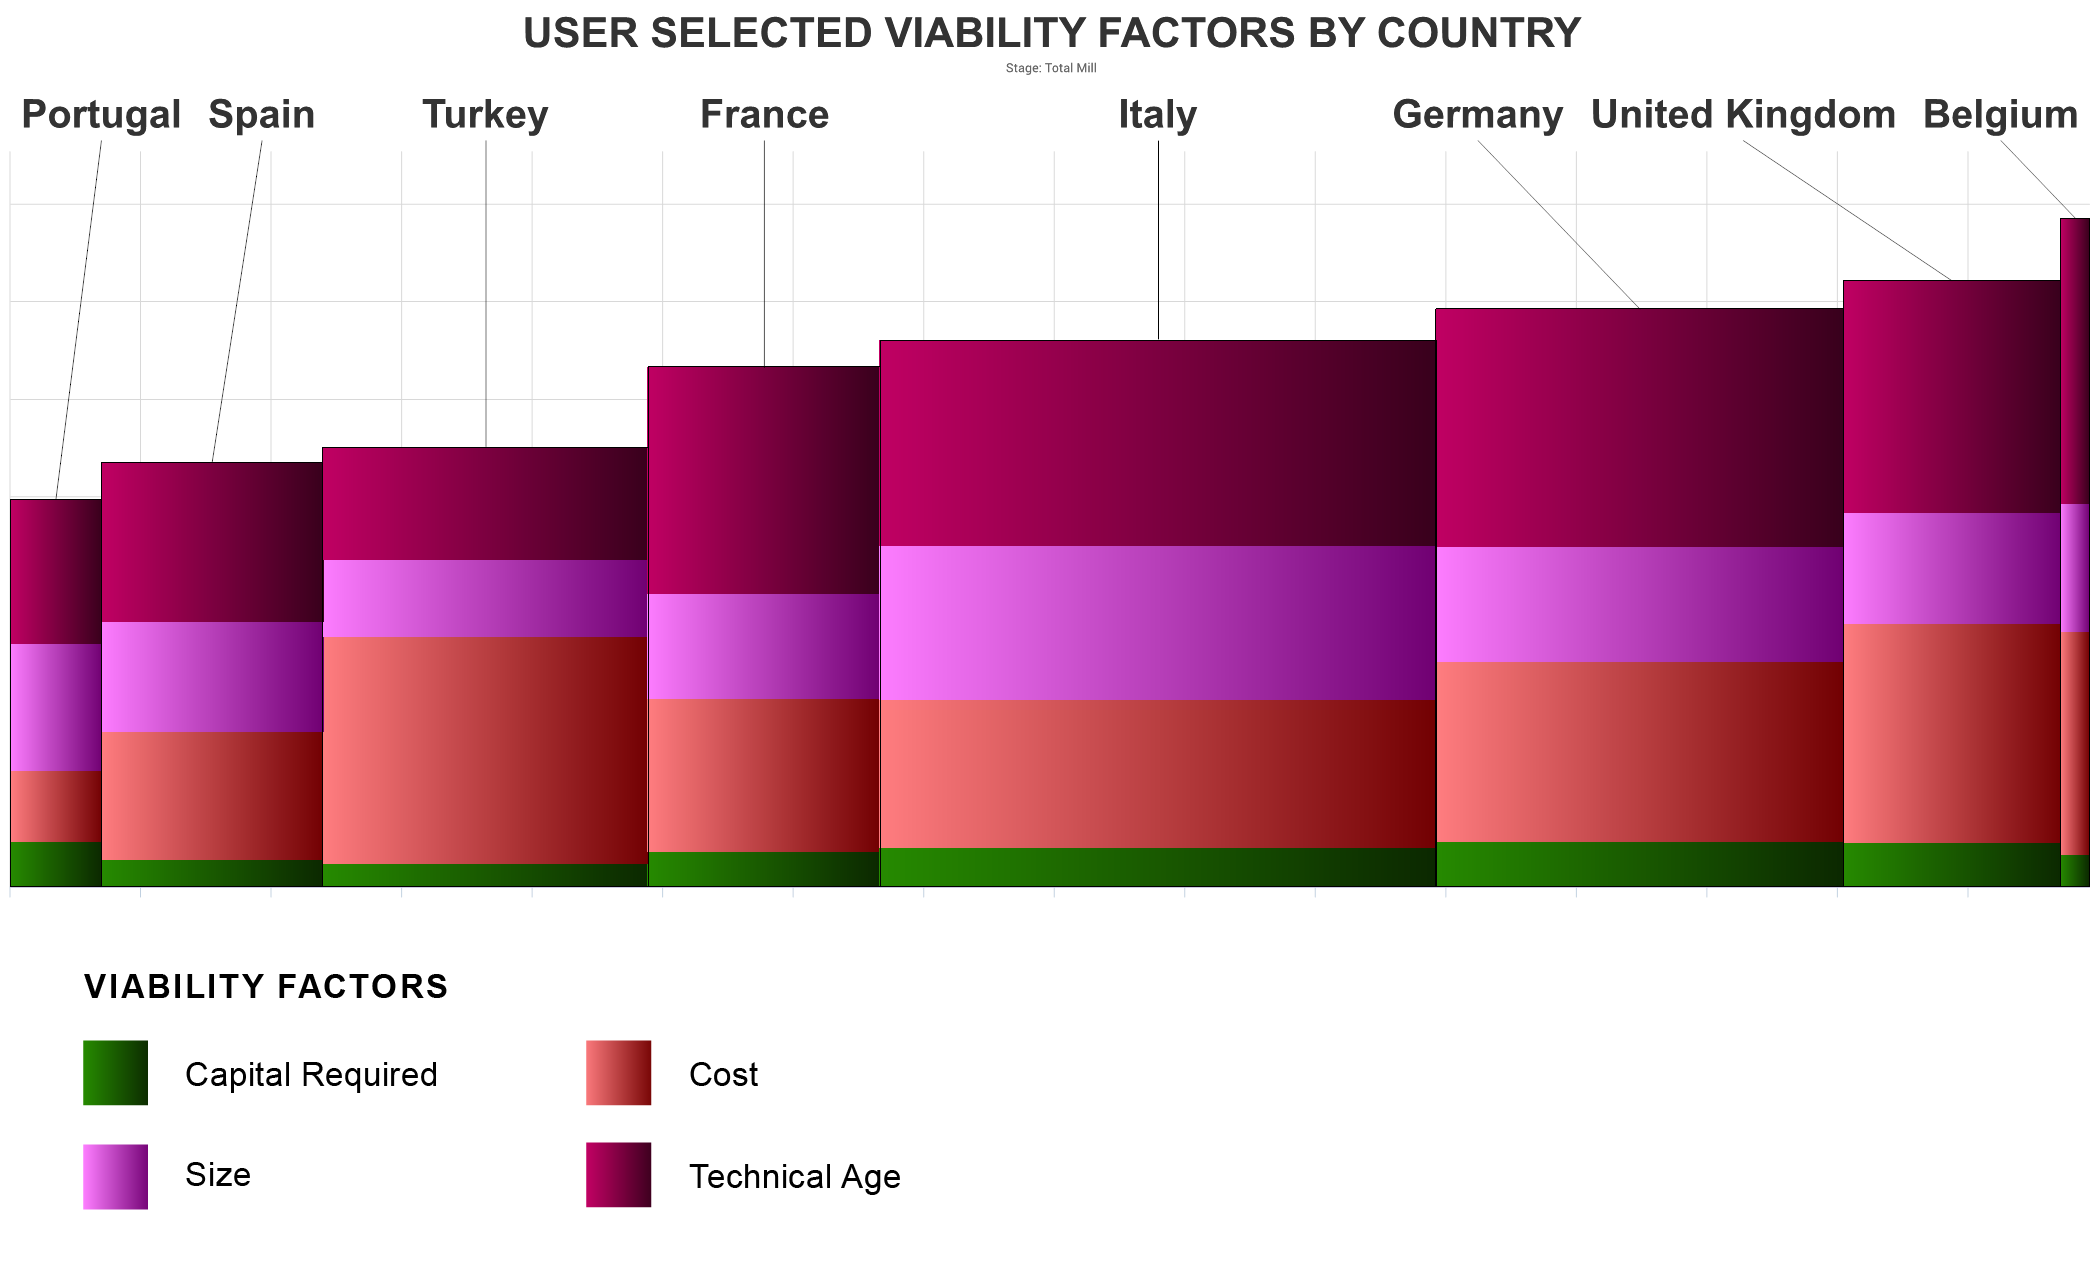
The main tissue-producing countries that were shown in Figures 3 and 4 were selected to form a competitive set for comparison. This set of countries is plotted in Figure 10 to provide a benchmark of Mexico's tissue machine fleet. The adjusted average technical age is plotted on the X-axis to indicate relative capability based on installation date and timing of upgrades. This is also an indication of the potential speed and tissue quality. The Y-axis shows the machine's finished roll width or trim and indicates how productive the machine is for a given speed. Mexico's average machine is more recently updated than ones in Canada or the United States, but behind compared to Indonesia and Turkey. The United States’ machines are much wider and provide a competitive advantage. The older machines in Canada and the US tend to have more advanced process capabilities than the others, but do not reach the same machine speeds on average.
Figure 10: Mexico Tissue Machine Quality vs. Trade Partner
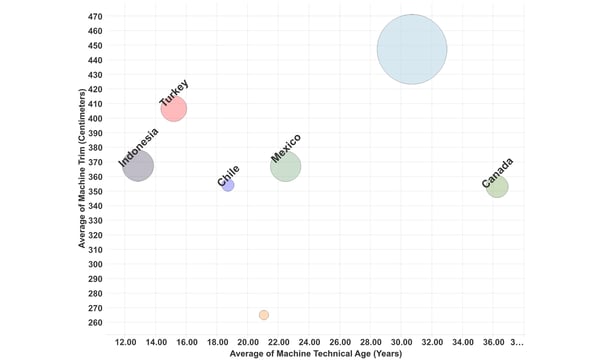
Source: FisherSolve
The relative average cash cost of tissue making for the same set of Mexico's trade partners is shown in Figure 11. Mexico has a relatively low-cost position with only Indonesia and El Salvador at an advantage. However, Mexico has a higher proportion of energy cost in total. The width of the bar shows the large capacity of the United States. Turkey, the United States, Chile, and Canada all offer higher costs than Mexico, which gives Mexico a cost advantage for export.
Figure 11: Mexico Tissue Production Cash Cost per Tonne vs Trade Partners
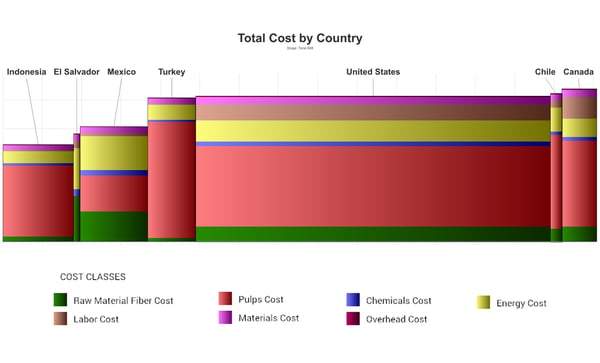
Source: FisherSolve
Figure 12 repeats the same average cash cost analysis but restates the production as cases of product versus tonnes of product. This provides an advantage to countries with a high proportion of advanced tissue processes as they can make more usable products at an equivalent performance rate with less fiber per case. Alternatively, this advantage can be taken to create higher performance products that sell for higher margins. This restatement shows Mexico slightly more advantaged than per tonne, as shown in Figure 11. However, it also shows how the United States, with a large proportion of advanced tissue machines, has costs that tend to be more competitive than a simple per tonne analysis.
Figure 12: Mexico Tissue Production Cash Cost per Product Case vs Trade Partner
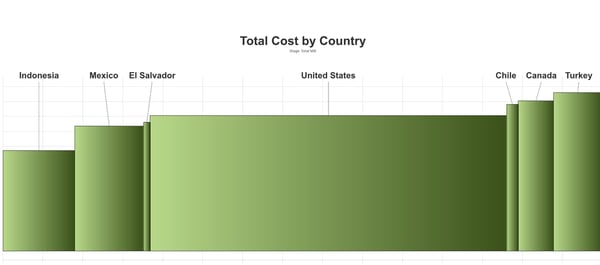
Source: FisherSolve
The cost analysis of Figures 11 and 12 provided a snapshot of current competitiveness on a cash cost basis. The Fisher Viability model offers a study that looks out over approximately five years regarding the capital investments required to remain competitive, such as size, technological age and other factors including cash costs, that will affect performance in the future. With that being said, Figure 13 shows that Mexico is in an excellent competitive position.
Figure 13: Mexico Tissue Machine Viability vs Trade Partners
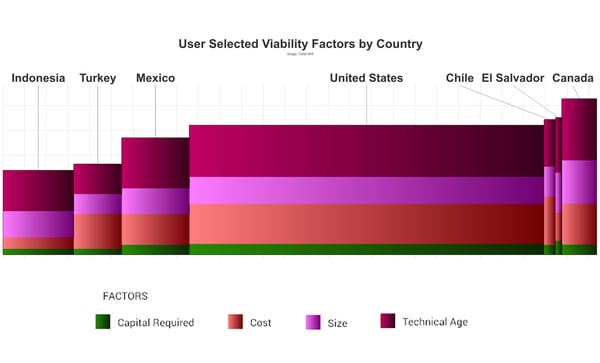
Source: FisherSolve
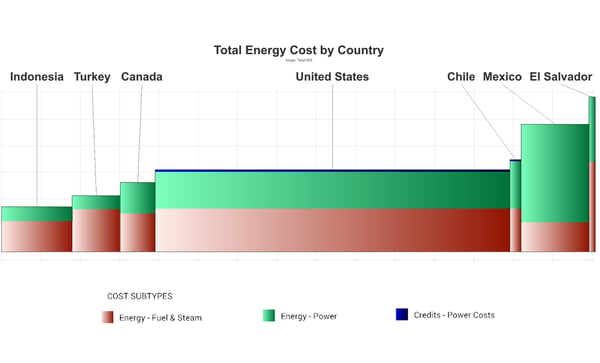
Analysis of the energy consumption in units of gigajoules per tonne of tissue produced and the cost of energy per tonne is helpful to compare the tissue operations in each country. Figure 14 shows the energy consumption in gigajoules per tonne for each country. Mexico is in the middle of the pack, but the United States and Canada consume more fuel and steam than the other countries. We know that any advanced tissue processes that avoid pressing will have higher energy consumption per tonne than conventional tissue making. Softer grades of tissue also employ increased drying in order to crepe at higher solids.
Figure 14: Mexico Tissue Energy Consumption GJ per Tonne vs Trade Partners
Source: FisherSolve
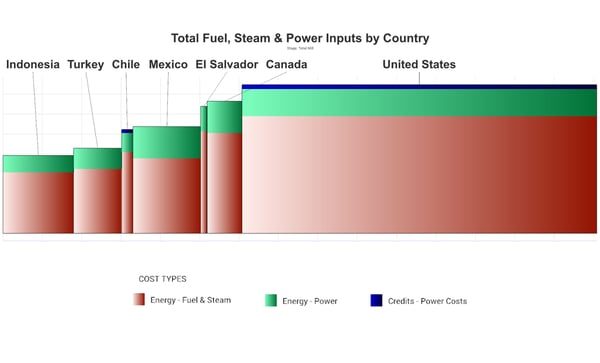
Figure 15 provides another way to look at energy consumption per tonne. Instead of energy units, this chart shows energy costs per tonne. Here we see Mexico having relatively high energy costs due to the cost of grid power. The United States and Canada are in the low energy cost range. Of course, the low-cost energy allows for soft and advanced tissue processes to run economically. Energy consumption provides a significant portion of the carbon footprint for tissue production in each country. Carbon footprint can be measured in many ways, depending on what type of comparison is desired. This carbon analysis employs a cradle to gate analysis to include all forms of carbon emitted, including when raw materials are gathered and prepared. Figure 16 shows that Mexico is in the middle of the pack with Chile, Turkey, and Indonesia. Canada on the other hand is very low, helped by its carbon-neutral hydropower. The United States has the highest tissue carbon footprint due to both soft tissue and the large portion of advanced tissue processes employed.
Figure 15: Mexico Tissue Energy Costs per Tonne vs Trade Partners
Source: FisherSolve
Figure 16: Mexico Tissue Carbon Emissions per Tonne vs Trade Partners
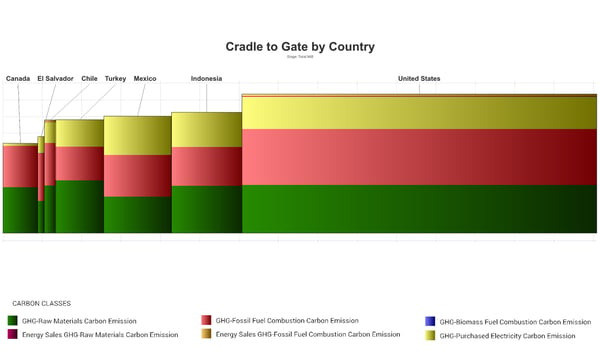
Source: FisherSolve
Mexico has grown its tissue business over the past two decades by taking advantage of its location and trade agreement within North America. As a result, most of the Mexican tissue trade, both imports and exports, is with the United States. This has allowed Mexico to grow its business beyond what is needed for domestic tissue consumption and start building a base to develop with other countries within Latin America. In addition, recent expansions with advanced tissue processes allow Mexico to compete for the premium private label business within the United States. This is also a force to compel domestic manufacturers in the United States and Canada to remain competitive in product performance and cost.
Analysis of competitive position requires specifics on tissue producers and individual machines. This article presents a static summary of Mexico's tissue industry today. Fiber prices, exchange rates, and environmental regulations will change, providing some participants with advantages and new challenges. In addition, Mexico's tissue mills will continue to change hands and consolidate, and neighboring countries may invest in tissue-making capacity, affecting Mexico's imports and exports.