The Republic of Serbia is emerging from both the global economic collapse of 2007 and 30 years of political instability stemming from multiple breakups of the former Yugoslavia. Agreements with Kosovo were extended in 2015, while the nation set a goal to join the European Union by 2025.
Serbia is landlocked bordering eight countries (Bosnia and Herzegovina, Bulgaria, Croatia, Hungary, Kosovo, Macedonia, Montenegro, Romania). About 58% of the land is used in agriculture and 32% is forested. Serbia’s population is older and shrinking at -0.47% with deaths exceed births and no net immigration.
Despite the shrinking population, Serbia’s economy has been growing when measured as GDP per capita. Figure 1 shows this trend as blue bars representing GDP/Capita in 2010 base US$. Overall GDP is growing about 1.9% per year (2017). The downward line represents the population loss over this same period. The political stability of the past 5 years should help to improve these metrics. However, the current COVID-19 pandemic could slow the recovery process.
Figure 1 Serbia GDP/Capita and Population
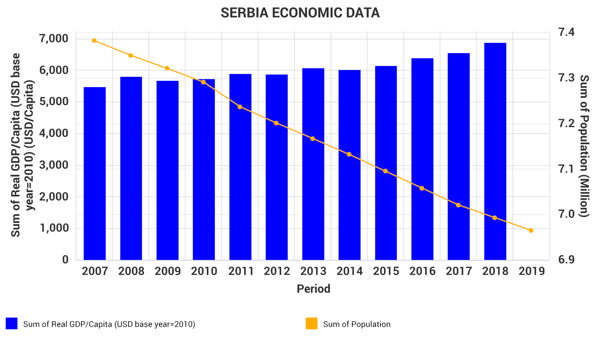
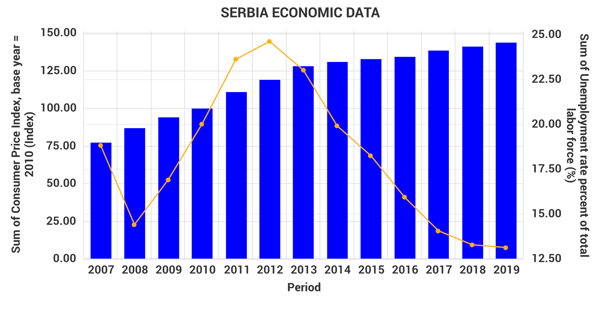
Figure 2 shows other key metrics for supporting tissue consumption. The inflation trend is shown as blue bars represented in constant 2010 US$ and has begun to slow after a steep increase from 2008 to 2012. The unemployment rate represented by the line shows significant improvement from the 25% rate in 2012, but the rate is still high compared to Western Europe.
Figure 2 Serbia Economic Data Inflation and Unemployment
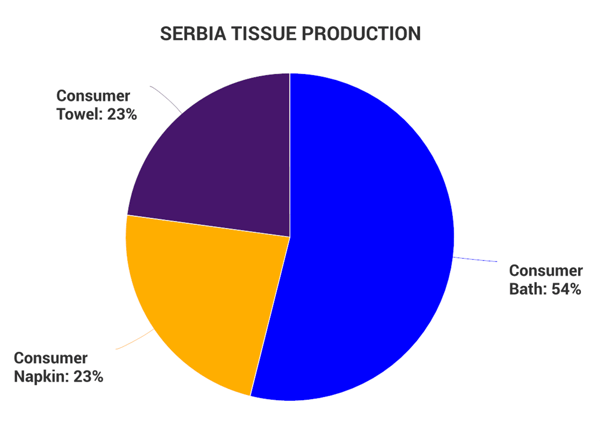
Serbia’s tissue production is limited to one mill and is focused on consumer grades. Figure 3 shows the production of this mill as more than half bath tissue with consumer towel and napkin products combining to fill the rest of the product portfolio. Commercial or away-from-home products and specialty tissue products are not produced in Serbia.
Figure 3 Serbia Tissue Production
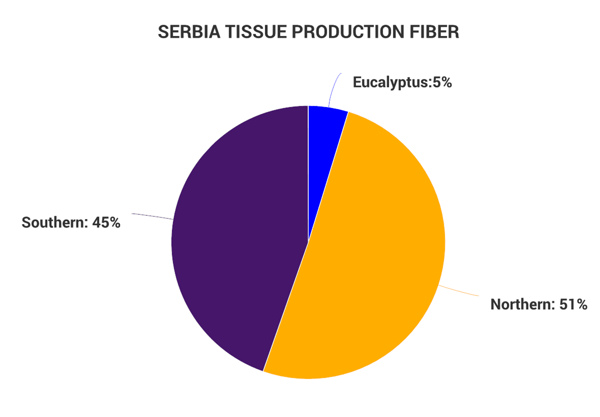
The tissue fiber source is 100% imported virgin bailed pulp. The furnish sources are split between northern and southern species with a small amount of eucalyptus as shown in Figure 4.
Figure 4 Serbia Tissue Fiber Sources
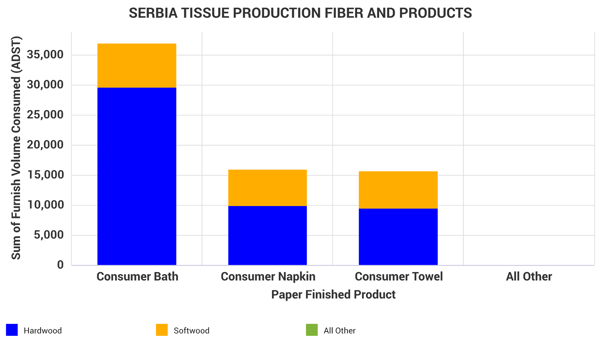
The application of the imported furnish is broken down by product in Figure 5. Consumer bath tissue uses a large proportion (about 80%) of hardwood fiber. Consumer napkin and towel products use a more balanced furnish with a roughly 60% hardwood and 40% softwood blend.
Figure 5 Serbia Tissue Production and Products
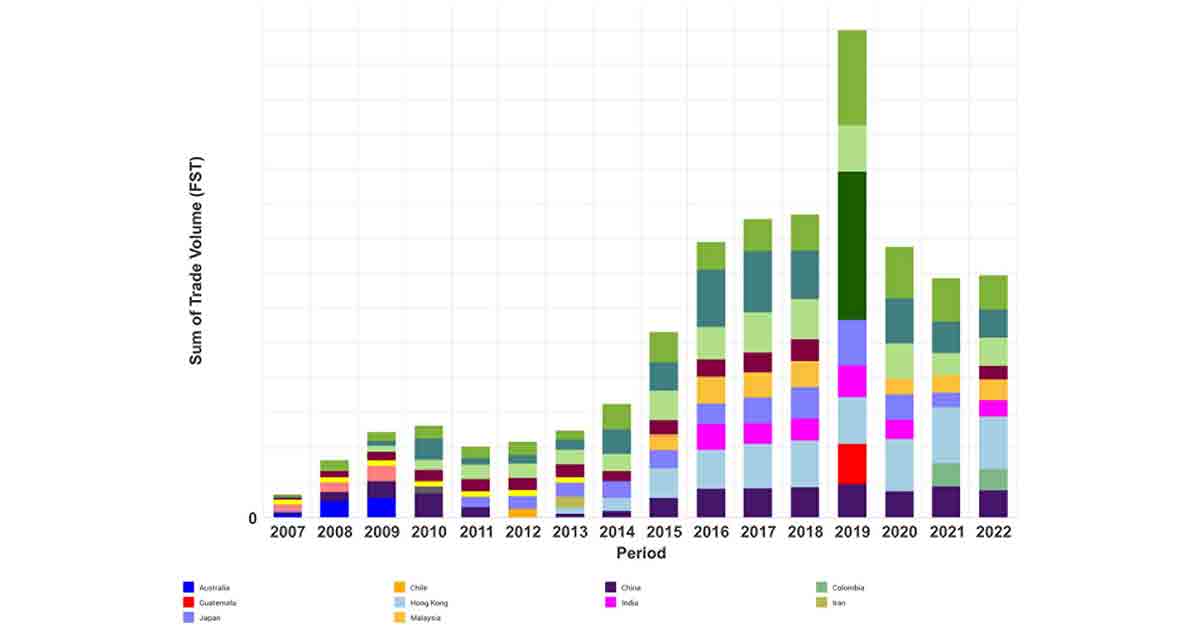
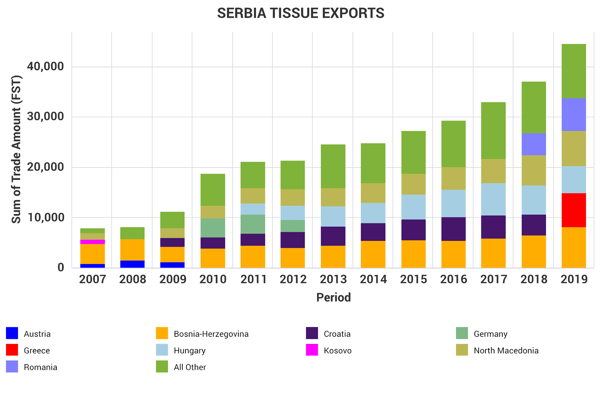
Serbia also participates in tissue trade, both importing and exporting tissue products. Figure 6 shows the evolution of tissue exports by Serbia since 2007. The increased export activity appears to follow the economic improvement shown in Figures 1 and 2.
Total tissue exports are now running slightly more than total Serbian domestic production. This probably indicates that Serbia is importing tissue parent rolls for converting and then re-exporting them. Key 2019 tissue customers were Bosnia-Herzegovina, Greece, Hungary, North Macedonia, and Romania.
Figure 6 Serbia Tissue Exports
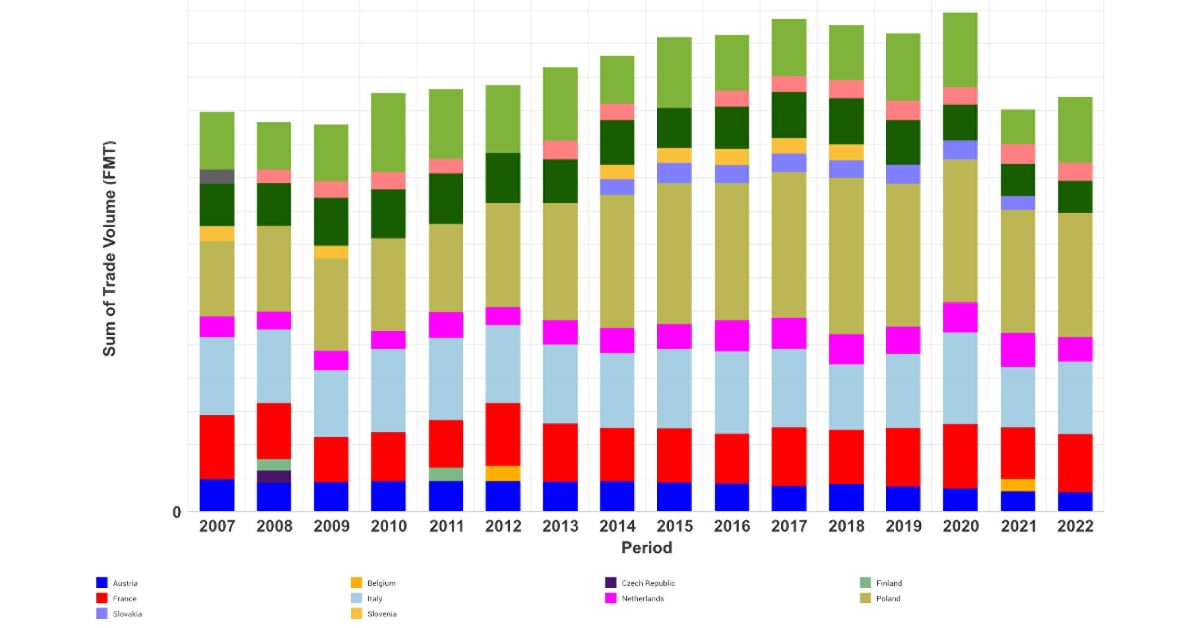
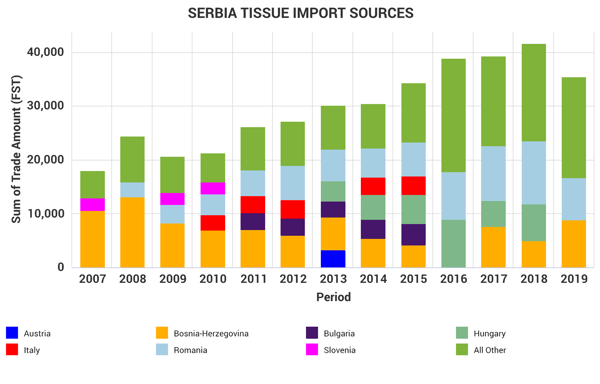
The corresponding “Serbia Tissue Imports” are shown in Figure 7. Tissue imports have also grown with the improved economy and are running in approximate balance in 2018 and 2019. Imports appear low in 2019 but this is not significant as UN ComTrade results are frequently reported late.
Tissue suppliers with more than 10% of the trade include Hungary, Bosnia-Herzegovina, Romania, and Italy.
Figure 7 Serbia Tissue Imports.
Figures 5, 6, and 7 show Serbia produces tissue required by its population but engages in trade at about the same rate to get the product formats required. It also suggests significant tissue parent rolls are exchanged for converting by other countries.
Total Serbian tissue consumption per person appears to be about 8 Kg/capita. This tissue consumption rate is typical of Eastern Europe but about half of Western Europe consumption rates. This suggests that aggregate Serbia tissue consumption has room to grow with future economic improvement, despite declining population.
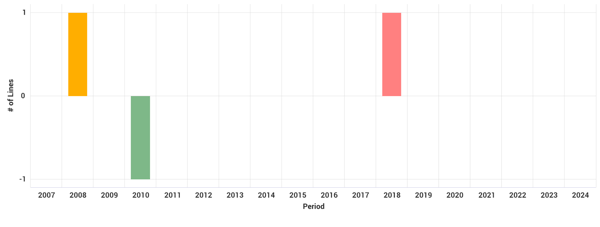
Serbia’s tissue producer has been careful in capacity additions to grow with consumer demand. Figure 8 shows tissue machine additions and retirements since 2007. One machine was retired in 2008, while new ones were added in 2010 and 2018.
Figure 8 Serbia Tissue Machine Retirements and Additions
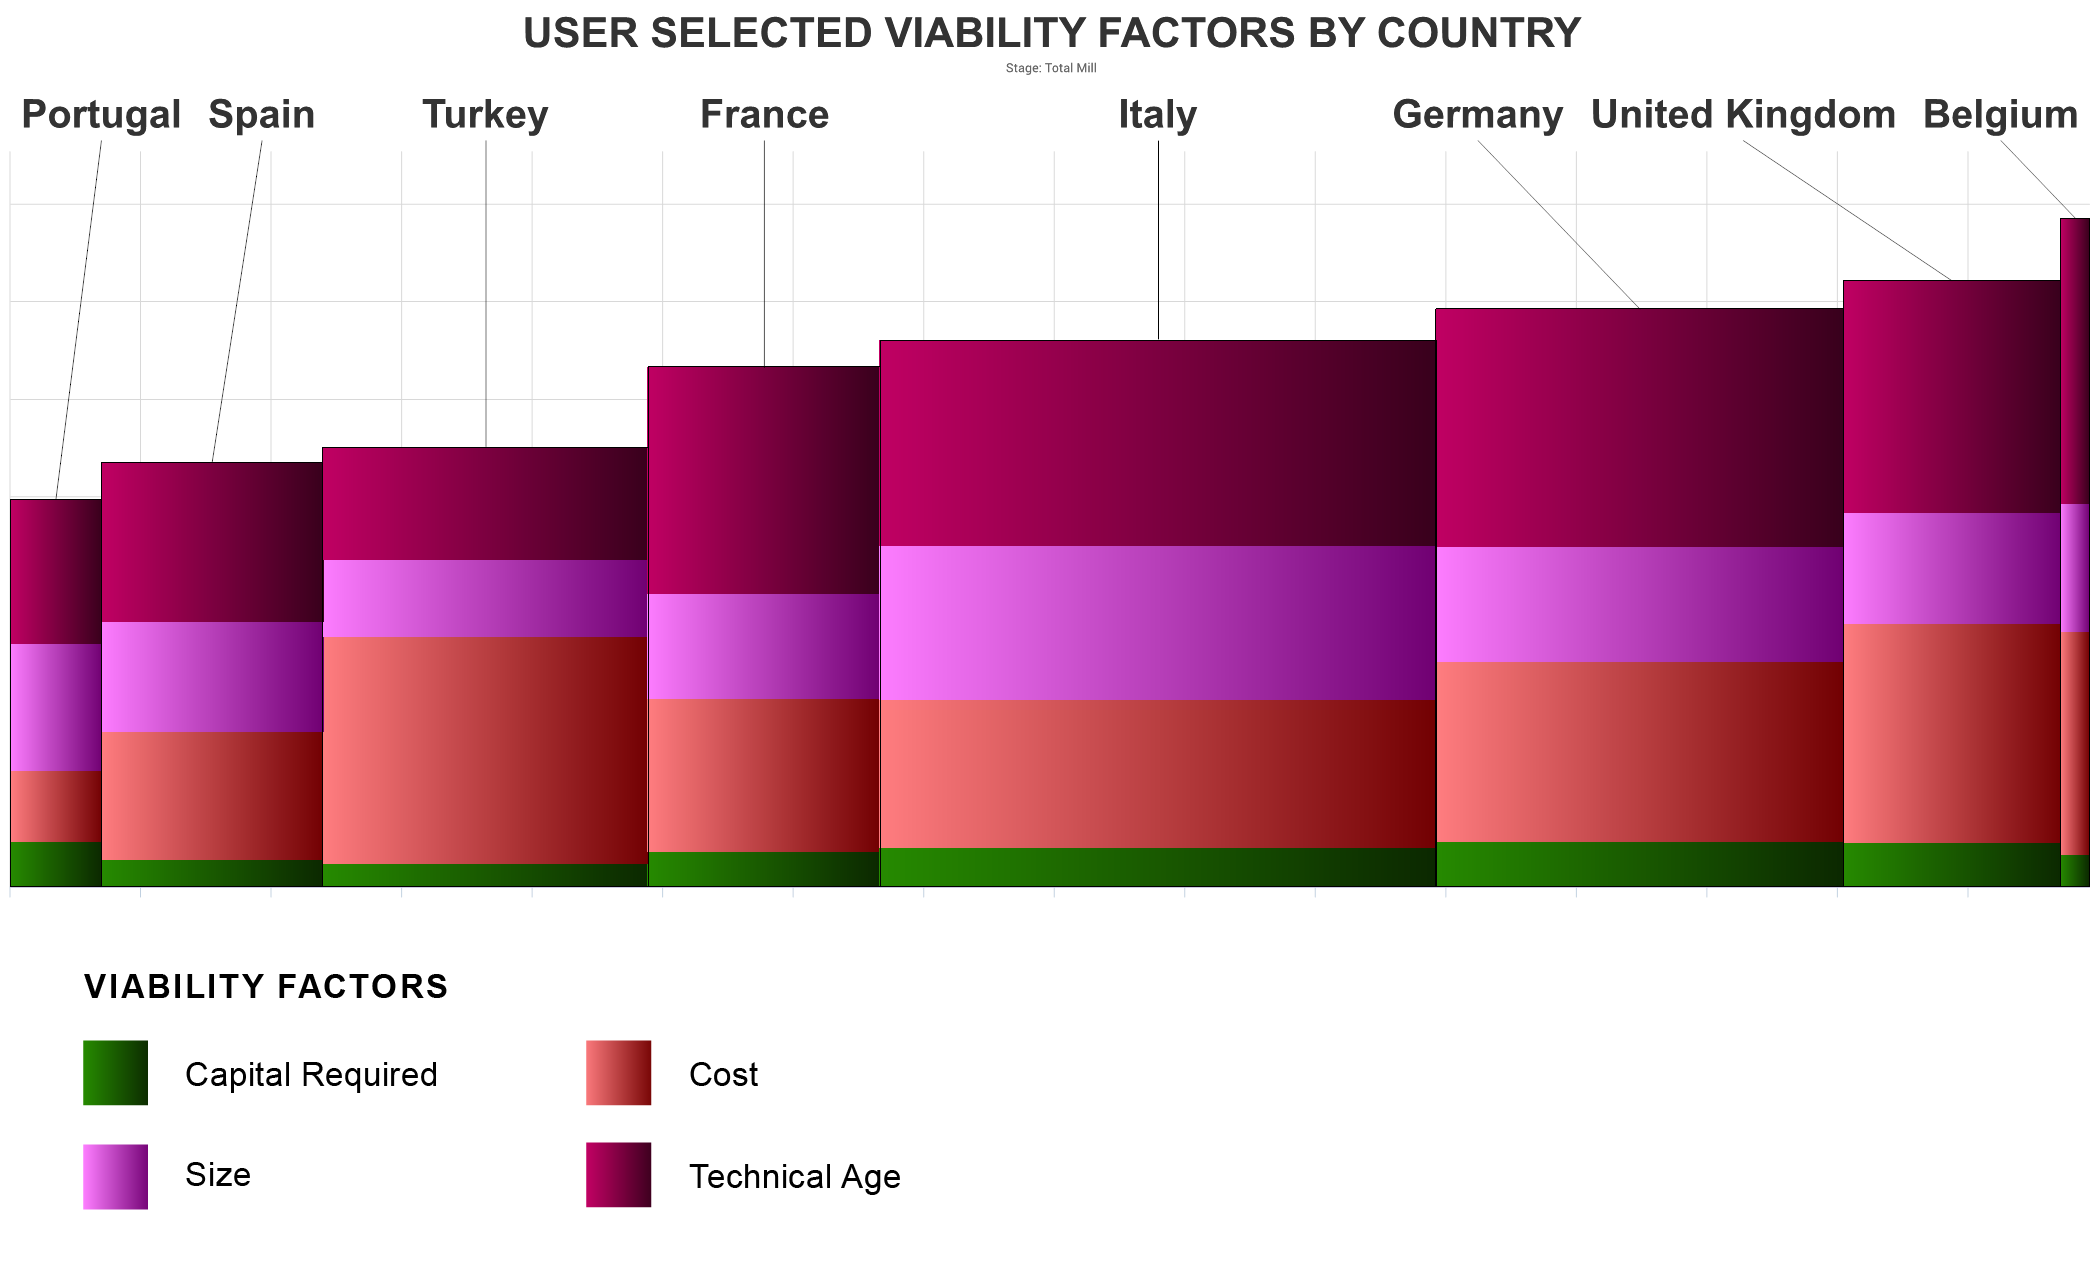
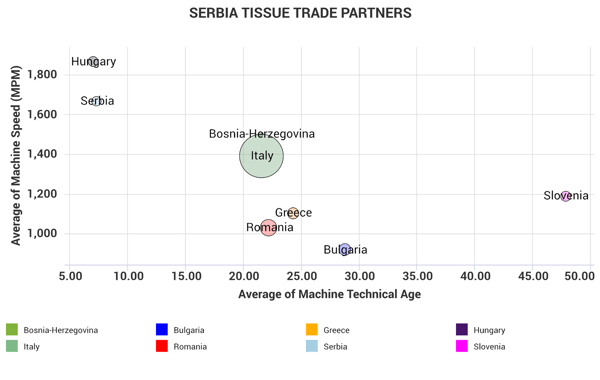
The significant tissue trade by Serbia with its neighbors allows comparison of the relative quality of the tissue machines in the trade mix. Hungary, Bosnia-Herzegovina, Romania, Italy Greece, Slovenia, and Bulgaria appear to be the current key trade partners. North Macedonia does not have tissue production.
Figure 9 shows the relative quality of the tissue machines using technical age and speed as indicators. The size of the bubble represents the relative scale of each country’s tissue production. Hungary and Serbia have the newest and fastest tissue machine fleets. Italy’s production size tends to overshadow Bosnia-Herzegovina, but they represent the next most productive tissue machine sets.
Figure 9 Serbia Tissue Trade Partners Tissue Machine Quality
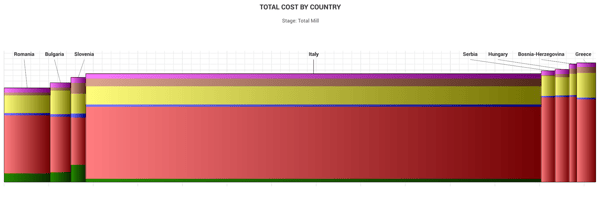
The relative cost position of Serbia’s tissue trade set is shown in Figure 10. Serbia does not have the lower cost recovered paper furnish component of Romania, Bulgaria, Slovenia, and Italy. Italy represents most of the production in this group.
Figure 10 Serbia Tissue Trade Partner Costs per Ton
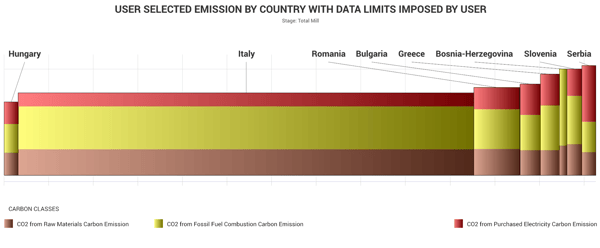
The cost of tissue manufactured can also be expressed as carbon emissions per ton. Figure 11 shows that the disadvantage for Serbia is the relative electric grid carbon production and not the tissue mill fuel consumed on-site.
Figure 11 Serbia Tissue Trade Partner Carbon Emissions per Ton
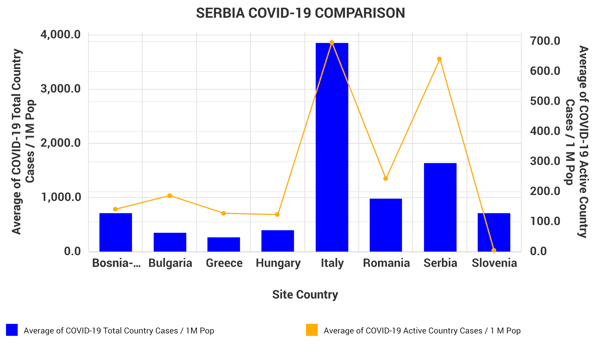
The current global pandemic is another risk to tissue production. FisherSolveTM Next offers up to date statistics by region, country and state or province to track the health of producers and consumers. Figure 12 shows the relative position (early June 2020) of Serbia relative to its trade partners. The blue bars represent average total cases per million of population and the yellow line is the current active case rate per million. Serbia and Italy are particularly hard hit at this point. We can hope that means the worst is over for them.
Figure 12 Serbia COVID-19 Comparison
Serbia’s tissue business appears to be positioned as a survivor. The economy is improving from a tough period of instability and there is very active trade in tissue products with the region. Serbia’s tissue machines are relatively new and fast for the region.
Tissue production cost is slightly high but reflects and imported furnish. Carbon emissions per ton are very high due to the carbon content of Serbia’s electric grid. This could be a problem for further export development are Western Europe moves to a lower carbon economy.
Serbia has followed Italy in the total number of COVID-19 cases per million and current infection rate. Hopefully, this indicates that both countries are closer to coming out of the epidemic.
This analysis of Serbia’s Tissue Business is done using averages of data from a point in time.