 Matt Elhardt
Over the last several months, an interesting flip has occurred in the OCC market. Prices for OCC bought on the spot market are now lower than those purchased in longer-term committed contracts.
We saw this flip occur in January and February of this year. This new trend can be seen in the figure below pulled from Recycled Fiber 360. Recycled Fiber 360 is our new pricing benchmark that provides exponentially better pricing insight on the US recycled fiber market as it's supported by actual transactional data.
Figure 1: US Southeast OCC Prices, Spot and Contract

Spot Price Vs Contract Price – What’s the Difference?
The spot price is the current price in the marketplace at which a given asset can be bought or sold for immediate delivery. Since this rate is typically determined by the availability of the commodity at the current time, the price is largely influenced by demand. Traders and investors tend to track the spot price of a commodity as they would stock prices.
Contract prices are the rate given by a provider for the transaction of a commodity that will occur later. The buyer is essentially locking in a price in advance.
When determining contract prices, the current spot price is normally taken into consideration as a starting point. But before landing on a final number, expected changes in supply and demand are taken into account as well. Final prices are typically adjusted utilizing some form of a price adjustment mechanism — often using premiums or discounts.
The Contrast in Prices
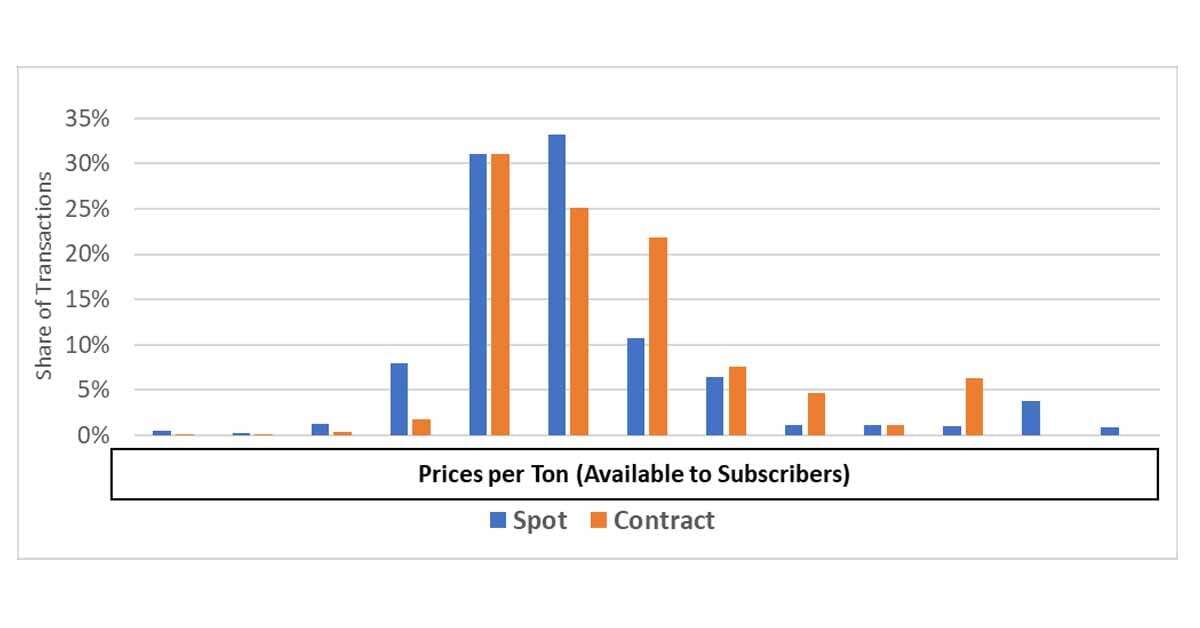
Using Recycled Fiber 360’s distribution chart to dig deeper, we can see the distribution of prices paid for contracted tons is noticeably higher than spot. At the $80/ton price points (fiber only – freight stripped), we see that contracted tons made up almost 23% of the market, double that of spot transactions.
Moreover, we can see that some mills are taking advantage of lower spot prices, with nearly 7% of tons contracted in the $50/ton tranche of prices.
Figure 2: US Southeast OCC Prices, Spot and Contract Distribution, April 2023

Why Are Spot Prices Lower Than Contract?
When trying to answer the “why” of it all, there are likely two main factors at play:
Lower Demand
Near the bottom of the market, with lower demand (mill operating rates), mills will continue to take committed tons. The lower demand against the same (or slightly less supply) dramatically drives prices down in the spot market. This results in spot prices being lower than the contract.
Collars/Floors
It is common for contracted tons to have so-called “collars” or “floors.” These prevent the price from falling past a certain point when being adjusted against a third-party index. In essence, these mills are paying “more” for volume than they otherwise would if they could buy on the spot market. There are of course trade-offs, as contracts provide stable volume and quality which is important to fiber planning.
Have We Reached the Bottom?
Theoretically, spot prices are the best indicator of relative supply/demand balance. This is something we can see and analyze within Recycled Fiber 360. We can clearly see the movement in spot prices over the past year as prices have fallen in the OCC sector.
The percentage of spot volume has also fallen (as mill production falls, they continue to receive contracted tons). However, as can be seen in April in Figure 3, the percentage of spot tons as reported by Recycled Fiber 360 has increased dramatically. This leaves us to wonder: Does this mean markets are starting to turn in OCC?
Figure 3: US Southeast OCC Share of Spot Purchases (Percent of Total)

Recycled Fiber 360: The Essential Platform for Reliable Transaction-Based Data
Recycled Fiber 360 is a benchmark for recycled fiber prices, designed to eliminate uncertainty and unreliable market noise. It is based on actual transactional sales data, providing reliable and transparent information on price movements in the recycled fiber index for various regions.
Unlike other reporting solutions, participants must contribute in order to access the monthly aggregated information. This ensures that the data provided is of top quality and only available to platform users while remaining confidential and anonymized.
In order to gain a better understanding of how Recycled Fiber 360 can provide transparent data for negotiating fiber prices, download our eBook. It includes hypothetical market examples to illustrate the benchmark's effectiveness.