


US forest industry performance in August and September was recently reported by both the US government and the Institute for Supply Management.
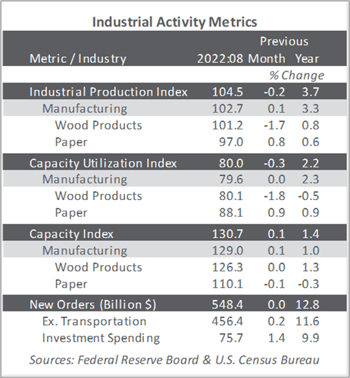
Total industrial production (IP) decreased 0.2% in August (+3.7% YoY). The index for mining was unchanged after posting five consecutive monthly gains, and the index for utilities decreased 2.3%. Manufacturing output edged up 0.1% after July’s +0.6%. Wood products was among the few durable-manufacturing industries exhibiting a decline in output. Within nondurables, increases for petroleum and coal products, paper, and chemicals offset decreases for most other industries.
The Institute for Supply Management’s (ISM) monthly sentiment survey of US manufacturers narrowly avoided contraction in September. The PMI registered 50.9%, down 1.9PP from August. (50% is the breakpoint between contraction and expansion.) Subindexes with notable changes include employment (-5.5PP), new orders (-4.2PP), slow deliveries (-2.7PP), and customer inventories (+2.7PP). Activity in the services sector decelerated slightly (-0.2PP, to 56.7%). Exports (+3.2PP), imports (+3.1PP), employment (+2.8PP), and input prices (-2.8PP) exhibited the largest changes.
Survey headline results from S&P Global (formerly IHS Markit) were mixed relative to their ISM counterparts—S&P Global’s manufacturing PMI inched higher while ISM’s decelerated; also, S&P’s services PMI contracted more slowly (posting its second-worst quarter since 2009) whereas ISM’s reflected modest expansion.
“With U.S. manufacturers reporting a return to growth of order books for the first time in four months, as well as improved job gains, the September survey brings welcome news that business conditions are starting to improve again,” wrote S&P Global’s Chris Williamson. “However, even with the latest improvement, the weakness of the data in recent months still point to manufacturing acting as a drag on the economy in 3Q, and demand will need to revive further if any meaningful positive contribution to GDP is going to be seen in the rest of the year.”
The consumer price index (CPI) rose 0.1% in August (+8.3% YoY) after being unchanged in July. Increases in the shelter, food, and medical care indexes were the largest of many contributors to the broad-based monthly all-items increase. These increases were mostly offset by a 10.6% decline in the gasoline index. The food index kept rising, increasing 0.8% MoM as the food-at-home index rose 0.7%. The energy index fell 5.0% MoM as the gasoline index declined, but the electricity and natural gas indexes increased.
Meanwhile, the producer price index (PPI) fell 0.1% (+8.7% YoY) after a 0.4% decrease in July and +1.0% in June. August’s decrease in the final-demand index is attributable to a 1.2% decline in prices for final demand goods, led by a 12.7% drop in the gasoline index. In contrast, the index for final-demand services advanced 0.4%, led by margins for fuels and lubricants retailing.
Price index performance in the forest products sector specifically included:
- Pulp, paper & allied products: +0.8% (+14.0% YoY)
- Lumber & wood products: -0.5% (+10.1% YoY)
- Softwood lumber: -3.1% (+14.8% YoY)
- Wood fiber: -0.6% (+4.1% YoY)
