


The following was recently published by our friends at Forest Resources Association. It was authored by Charlie Blinn, Professor, U of MN, Dept. of Forest Resources and reviewed by Tim O’Hara, FRA Vice President of Government Affairs and Lake States Region Manager.
Rising fuel prices impact everyone’s pocketbook through increased costs which are driving up prices. This increase in cost is especially true for the trucking industry, which is critical to maintaining the supply chain and is often viewed as a barometer of the U.S. economy. While 2020 data from the U.S. Department of Energy Alternative Fuels Data Center shows that the average fuel economy for cars was 24.2 miles/gallon, it was 5.29 miles/gallon for heavy trucks with a gross vehicle weight rating exceeding 33,000 pounds, such as a 5-axle tractor-trailer log truck. As trucks are vital for moving raw forest products from in-woods harvest sites to mill consumers, rising fuel prices significantly impact the cost of those deliveries.
Recent news events have highlighted the impacts of increasing fuel costs on the economy. To get a better understanding of that impact on the transportation of raw forest products from in-woods operations to the mill, online data were used to look at the history of diesel fuel prices over the past 15 years as well as the impact of rising diesel prices on log trucks and delivered wood today.
Historic View of Diesel Prices Since 2007
Across the entire US, No. 2 diesel retail prices generally were within the range of $2 - $4/gallon between 2007-2021 (Figure 1). During mid-June 2019, the average retail price for No. 2 diesel across the US was $3.105/gallon before falling to $2.396/gallon during the same week in 2020 as consumption dropped due to falling demand and rising supplies during the beginning of the Covid-19 pandemic. In response to rising demand worldwide, changes in US energy policy reduced domestic production and by OPEC, along with Russia’s invasion of Ukraine, the average price rose to $3.286/gallon in mid-June 2021 and to $5.718/gallon today.
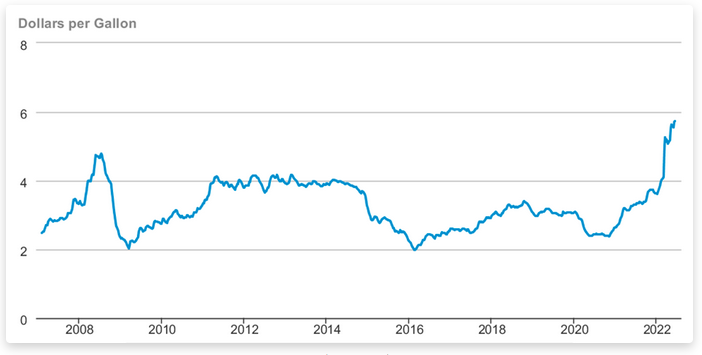 Figure 1: Weekly U.S. No. 2 diesel ultra-low sulfur (0-15 ppm) retail prices in the United States between February 2007 – mid-June 2022.
(Source: U.S. Energy Information Administration).
The mid-June 2019 – 2022 retail price per gallon for No. 2 diesel fuel is shown by state in Table 1. Between mid-June 2020 to today, the retail price has increased by an average of 141.0% with the lowest rate of increase during the past two years in the West Coast and the highest in the Midwest.
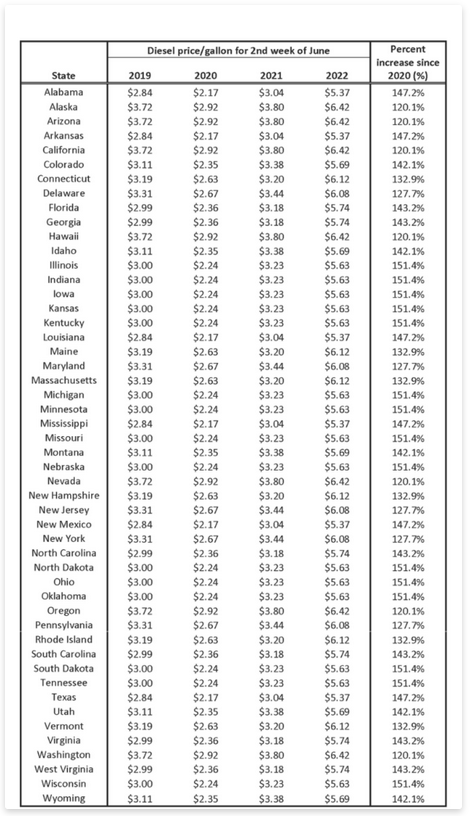 Table 1: The mid-June 2019-2022 retail price per gallon by state for No. 2 diesel. (Source: U.S. Energy Information Administration).
Estimated Roundtrip Cost of Diesel to Transport a Load
According to the U.S. Department of Commerce Economic Census on Transportation 2017 (Table A5a), the U.S. average roundtrip distance to transport “logs and other wood in the rough” is 138 miles. After equipping 31,170 Class 7 and Class 9 trucks with a telematics tracking device for one year, Geotab created a map of average miles per gallon (MPG) for heavy-duty trucks in states and provinces across the U.S. and Canada. (Data were not available for Alaska, Hawaii, and Rhode Island.) Using the Geotab average fuel efficiency by state, a roundtrip of 138 miles, and mid-June retail prices for No. 2 diesel ultra-low sulfur (0-15 ppm), the estimated roundtrip cost for diesel from an in-woods location to consuming mills was calculated for 2020, 2021 and today in 2022 for each of the 47 states (Figure 2).
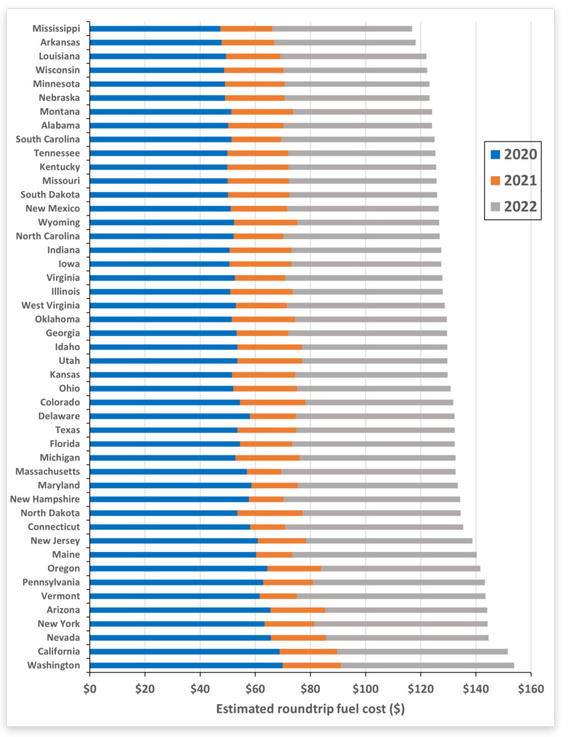 Figure 2: Estimated mid-June round trip cost for No. 2 diesel ultra-low sulfur (0-15 ppm) in 2020, 2021, and 2022 for transporting logs and
other wood from an in-woods location to a mill in each state, assuming a roundtrip of 138 miles.
Under those assumptions, Figure 2 shows that the roundtrip cost for diesel fuel is much higher today than it was two years ago. While the range in roundtrip fuel costs was from $47.28 - $69.91 in 2020, it is $116.89 - $153.88 today with Mississippi being the lowest in both years and Washington the highest. Regionally, the Gulf Coast states (Alabama, Arkansas, Louisiana, Mississippi, New Mexico, and Texas) have the lowest roundtrip fuel cost, and the West Coast states (Arizona, California, Nevada, Oregon, and Washington) have the highest cost.
Estimated Increase in Delivered Costs
The USDA-Forest Inventory and Assessment estimate that the current timber volume harvested is 446.3 million green tons with the highest harvest rates in the U.S. West and the Southeast (Figure 3). Hauling that amount of volume from in-woods locations to the mill would take approximately 15.4 million truck deliveries (based on 29 green tons per load). Using the information presented above for an average haul distance of 138 miles (roundtrip) and an average 6 MPG, the change in diesel fuel prices from 2020 to 2022 has resulted in an estimated average cost increase of $2.88 per green ton for delivered raw forest products (Figure 4). The total impact to the forest products sector is estimated at more than $1.2 billion in added fuel costs from 2020 to June 2022 to deliver raw forest products from in-woods operations to a manufacturing or energy facility. The largest impacts are in Georgia, Alabama, and Oregon (Figure 5).
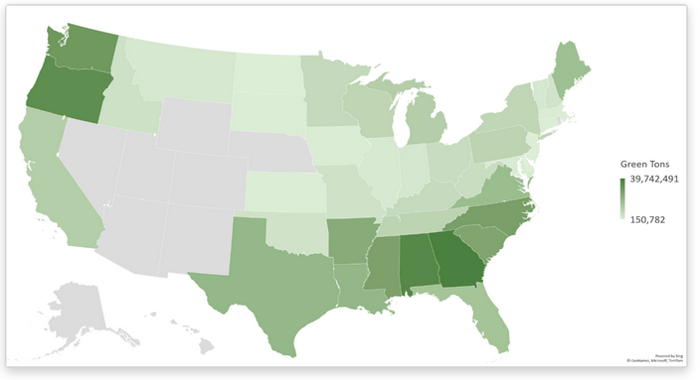 Figure 3: Shaded map of estimated annual timber harvest volume of states included in the analysis. Darker shades are higher
timber harvest rates while lighter shades show smaller harvest volumes.
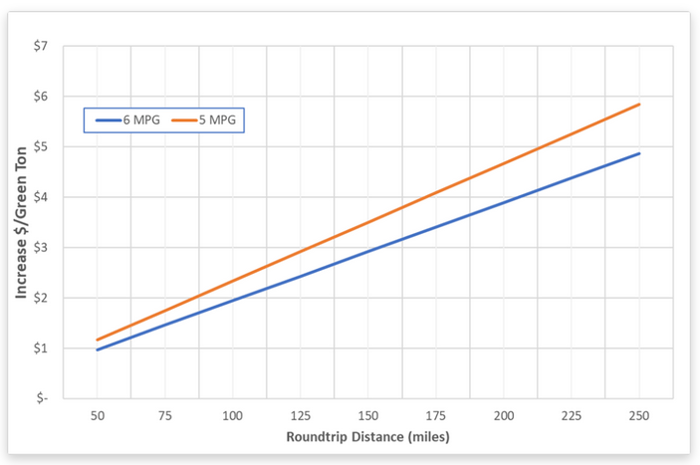 Figure 4: The estimated increase in delivery cost per green ton for transporting raw forest products from an in-woods
location to a mill for trucks averaging 5 and 6 miles per gallon.
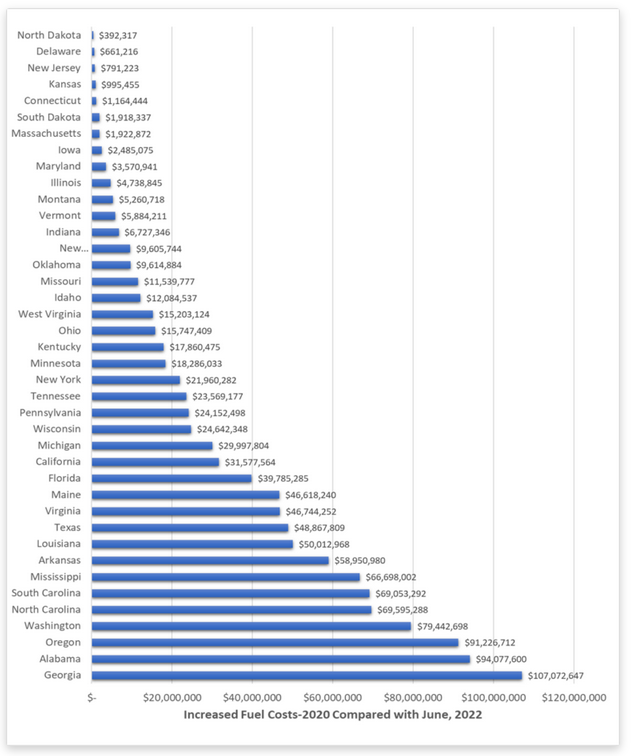 Figure 5: The estimated increase in cost to transport raw forest products from in-woods locations to mills due to the increase in diesel fuel prices from 2020 to June 2022 by state. The estimate is based on trucks averaging 6 miles per gallon and a roundtrip distance of 138 miles.
Sources:
- USDA FIA EVALIDator
- Geotab. N.d. The State of Fuel Economy in Trucking.
- U.S. Department of Commerce. 2020. United States 2017 Economic Census: Transportation. 2017 Commodity Flow Survey. U.S. Department of Commerce, U.S. Census Bureau, Washington, DC. EC17TCF-US. 178 p.
- U.S. Department of Energy. 2020. Average fuel economy by major vehicle category. U.S. Department of Energy, Alternative Fuels Data Center.
- U.S. Energy Information Administration. 2022. Petroleum & other liquids. Weekly retail gasoline and diesel prices. Washington, DC.
