


US forest industry performance in March and April was recently reported by both the US government and the Institute for Supply Management.
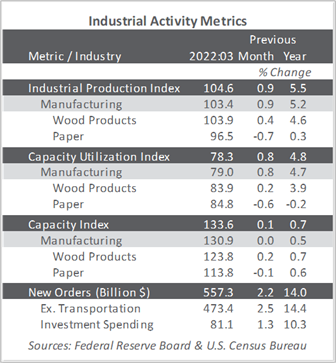
Total industrial production (IP) advanced 0.9% in March (+5.5% YoY)—resulting in an annualized rate of +8.1% during 1Q. Manufacturing output gained 0.9% (+5.4% QoQ), thanks primarily to motor vehicles and parts (+7.8%); factory output elsewhere moved up 0.4%. The index for utilities increased 0.4%, and the index for mining advanced 1.7%. The gain in mining suggests US oil companies and shale producers are ramping up production in response to oil’s price.
The Institute for Supply Management’s (ISM) monthly sentiment survey for April 2022 reflected a slightly smaller proportion of U.S. manufacturers reporting expansion. The PMI registered 55.4%, a decrease of 1.7PP. (50% is the breakpoint between contraction and expansion.) As shown in Table 4, the subindexes for employment (-5.4PP), order backlogs (-4.0PP) and inventories (-3.9PP) exhibited the largest changes. Input-price increases decelerated slightly (-2.5PP).
The services sector also declined in April (-1.2PP, to 57.1%). Imports (+7.9PP), inventory sentiment (+6.5PP) and new orders (-5.5PP) saw the largest changes. Input prices again pushed higher (+0.8PP). All industries we track expanded.
IHS Markit’s survey headline results were mixed relative to their ISM counterparts—manufacturing: ISM fell while Markit rose; services: both ISM and Markit retreated.
"After a slow start to the year, which saw production growth almost stall, the manufacturing sector is starting 2Q on a much stronger footing,” Markit's Chris Williamson observed. “Demand from consumers and businesses is proving encouragingly robust despite severe inflationary pressures, which intensified further during April.
"Both input cost and selling price inflation surged higher—the latter accelerating to a near-record rate—as firms faced rising energy prices, ongoing supplier-driven price hikes amid strained supply chains, and rising wage costs.
"In short, while the survey data add to indications the pace of economic growth will improve in 2Q after a lackluster 1Q, the less welcome news is that elevated inflationary pressures show no signs of relenting," Williamson concluded
After rising 0.8% in February, the consumer price index (CPI) increased 1.2% in March (+8.5% YoY, the largest 12-month jump since the period ending December 1981). The indexes for gasoline, shelter, and food were the largest contributors to the seasonally adjusted all-items increase. The gasoline index rose 18.3% in March and accounted for over half of the all-items monthly advance; other energy component indexes also moved up. The energy index rose 32.0% over the last year, and the food index increased 8.8%, the largest 12-month increase since the period ending May 1981.
Meanwhile, the producer price index (PPI) accelerated to +1.4% MoM (+11.2% YoY, the largest increase since 12-month data were first calculated in November 2010). This rise followed advances of 0.9% in February and 1.2% in January. The rise in the final-demand index was led by a 2.3% advance in prices for goods (especially a 20.4% MoM jump in diesel fuel prices). The index for services increased 0.9%, over 40% of which can be traced to a 1.2% rise in margins for final demand trade services.
Price index performance in the forest products sector specifically included:
- Pulp, paper & allied products: +1.6% (+17.8% YoY)
- Lumber & wood products: +3.5% (+19.3% YoY)
- Softwood lumber: +7.6% (+22.9% YoY)
- Wood fiber: +0.4% (+4.7% YoY)
