


US forest industry performance in June and July was recently reported by both the US government and the Institute for Supply Management.
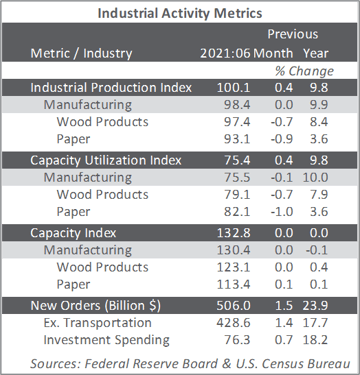
Total industrial production (IP) increased 0.4 percent in June (+9.8 percent YoY, but 1.2 percent below its February 2020 level). In June, manufacturing output edged down less than 0.1 percent, as an ongoing shortage of semiconductors contributed to a decrease of 6.6 percent in the production of motor vehicles and parts. Excluding motor vehicles and parts, factory output increased 0.4 percent. The output of utilities advanced 2.7 percent, reflecting heightened demand for air conditioning. The index for mining increased 1.4 percent.
For 2Q overall, total IP rose at an annual rate of 5.5 percent. Manufacturing output increased at an annual rate of 3.7 percent despite a drop of 22.5 percent for motor vehicles and parts.
The Institute for Supply Management’s (ISM) monthly sentiment survey showed another slight decrease in the proportion of US manufacturers reporting expansion in July. The PMI registered 59.5 percent, a dip of 1.1PP from the June reading. (50 percent is the breakpoint between contraction and expansion.) The sub-indexes for imports (-7.3PP), input prices (-6.4PP) exhibited the largest changes.
By contrast, the services sector jumped to a new all-time high of respondents reporting expansion (+4.0PP, to 64.1 percent). The most noteworthy changes in the sub-indexes included exports (+15.1PP), imports (-6.6PP) and employment (+4.5PP).
IHS Markit’s July survey headlines conflicted with their ISM counterparts:
- Manufacturing: Markit’s PMI ticked up to a new record high while ISM’s fell further.
- Services: Markit decelerated sharply while ISM soared to a new record.
“July saw manufacturers and their suppliers once again struggle to meet booming demand, leading to a further record jump in both raw material and finished goods prices,” wrote Markit’s Chris Williamson. “Despite reporting another surge in production, supported by rising payroll numbers, output continued to lag well behind order book growth to one of the greatest extents in the survey’s 14-year history, leading to a near-record buildup of uncompleted orders.
“Capacity is being constrained by yet another unprecedented lengthening of supply chains, with delivery delays reported far more widely in the past two months than at any time prior in the survey’s history. Manufacturers and their customers are consequently striving to maintain adequate inventory levels, often reporting the building of safety stocks where supply permits, to help keep production lines running and satisfy surging sales.
“The result is perhaps the strongest sellers’ market that we’ve seen since the survey began in 2007,” Williamson concluded, “with suppliers hiking prices for inputs into factories at the steepest rate yet recorded and manufacturers able to raise their selling prices to an unprecedented extent, as both suppliers and producers often encounter little price resistance from customers.”
That lack of resistance against price increases, especially if it persists, may be an indication of inflation expectations becoming unanchored. If consumers develop a “psychology” of buying today because they expect the cost of goods or services will be higher tomorrow, the end result will be a self-fulfilling prophecy of higher price pressures.
The consumer price index (CPI) increased 0.9 percent in June (+5.4 percent YoY). These were the largest changes since June and August 2008, respectively. The index for used cars and trucks continued rising sharply (+10.5 percent) and accounted for more than one-third of the all-items MoM increase. The food index increased 0.8 percent in June, double May’s rate of increase. The energy index advanced 1.5 percent, with the gasoline index rising 2.5 percent MoM (+45.1 percent YoY).
Meanwhile, the producer price index (PPI) increased 1.0 percent in June (+7.3 percent YoY), nearly 60 percent of which can be traced to a 0.8 percent increase in prices for final-demand services—especially margins related to automobile retailing. The index for final-demand goods moved up 1.2 percent, led by industrial chemicals (+4.5 percent).
In the forest products sector, price index performance included:
- Pulp, paper & allied products: +1.9 percent (+10.5 percent YoY)
- Lumber & wood products: +1.6 percent (+47.6 percent YoY)
- Softwood lumber: -2.1 percent (+125.3 percent YoY)
- Wood fiber: +0.7 percent (+11.1 percent YoY)
