


US forest industry performance in January and February was recently reported by both the US government and the Institute for Supply Management.
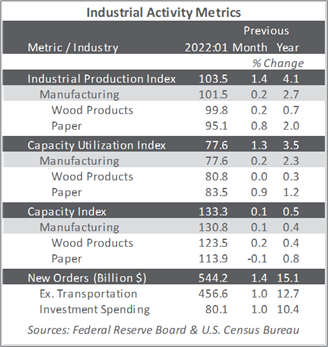
Total industrial production (IP) increased 1.4 percent in January (+4.1 percent YoY and 2.1 percent above February 2020’s pre-pandemic reading). Manufacturing output and mining production rose 0.2 percent and 1.0 percent, respectively. The index for utilities jumped by a record 9.9 percent, reflecting a surge in demand for heating because of significantly colder-than-normal temperatures.
Within durables, miscellaneous manufacturing and machinery posted the largest gains, while motor vehicles and parts and nonmetallic mineral products posted the largest losses. Within nondurables, sizable increases were recorded by textile and product mills; food, beverage, and tobacco products; and paper; the largest losses came in the indexes for printing and support and for petroleum and coal products.
The Institute for Supply Management’s (ISM) monthly sentiment survey for February 2022 reflected a slightly larger proportion of US manufacturers reporting expansion. The PMI registered 58.6 percent, an increase of 1.0PP. (50 percent is the breakpoint between contraction and expansion.) The subindexes for order backlogs (+8.6PP), new orders (+3.8PP), and exports (+3.4PP) exhibited the largest changes.
The services sector retreated further in February (-3.4PP, to 56.5 percent). Exports (+7.1PP), order backlogs (+6.8PP), and new orders (-5.6PP) saw the largest changes. Input prices again pushed higher (+0.8PP). Of the industries we track, Paper Products and Construction expanded, while the rest contracted.
“We are getting price increases with no notice,” wrote one Construction respondent. “For example, our engineered wood products supplier gave us a 10 percent to 20 percent... increase, effective immediately. We are also struggling to get materials. Suppliers cite poor employee attendance, elevated employee turnover and positions open longer than normal as they struggle to fill them.”
After revisions back to January 2017, the consumer price index (CPI) increased 0.6 percent in January (+7.5 percent YoY) on contributions from food, electricity, and shelter. The food index rose 0.9 percent, accelerating from +0.5 percent in December. The energy index also moved up 0.9 percent, with an increase in the electricity index being partially offset by declines in the gasoline index and the natural gas index. In more relatable terms, a 7.5 percent YoY overall loss of purchasing power is akin to February’s income during a year (28/365 days = 7.7 percent).
The similarly revised producer price index (PPI) increased 1.0 percent in January (+9.7 percent YoY), on the heels of December’s +0.4 percent and November’s +0.9 percent. Prices for final-demand goods moved up 1.3 percent, nearly double the rate of services (+0.7 percent). The rise in goods was led by motor vehicles and equipment (+0.7 percent) whereas the hospital outpatient care price index (+1.6 percent) was a major contributor to higher services costs.
Price index performance in the forest products sector specifically included:
- Pulp, paper & allied products: +0.7 percent (+15.3 percent YoY)
- Lumber & wood products: +8.8 percent (+18.6 percent YoY)
- Softwood lumber: +24.4 percent (+20.1 percent YoY)
- Wood fiber: +2.3 percent (+5.4 percent YoY)

