The post-COVID global landscape continues to shift in a number of new directions within the pulp and paper industry as more companies begin to consider new acquisitions, line transitions and other types of investments. However, in such a capital-intensive industry, the decisions made, no matter how big or small, can have substantial consequences. Since we can’t peer into the future to see how each acquisition or transition will turn out, many players in the industry may be hesitant to make major investments.
While we don’t have a crystal ball, Fisher does have the next best thing – our virtual mills tool. This tool is an interactive enhancement of our business intelligence platform FisherSolve, which contains highly detailed and complete information on every pulp and paper mill in the world. So, what is a Virtual Mill?
A Virtual Mill is a confidential, user-defined mill that passes through Fisher's proprietary mass and energy balance model and is delivered to the client via FisherSolve. Virtual mills can represent any greenfield, brownfield, rebuild or grade change project. The virtual mill inputs are defined by the client and/or with Fisher consultants’ expertise. The virtual mills are modeled with the same rigor of existing sites and the results – such as cash costs, energy consumption, or carbon emissions – can be visualized and benchmarked against existing sites and other virtual mills in FisherSolve. Analysis of Virtual Mill results can provide significant insights for decision-making as multiple scenarios can be evaluated.
In order to make better sense of this, let’s look at a hypothetical use case.
Suppose additional capacity of 300,000 mt/yr of linerboard using virgin fiber is added in Europe through the investment and installation of a new paper machine in an existing site by our hypothetical company. The mill in question does not have enough pulping capacity, so it is assumed it will purchase part of the pulp needed. What is the impact of this new investment?
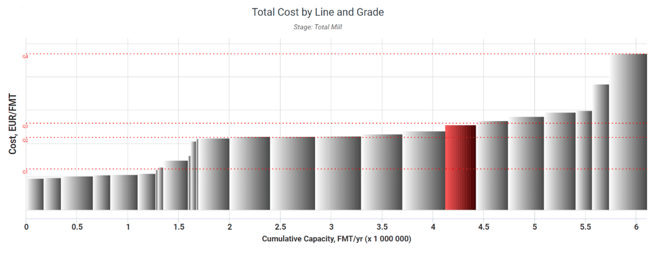
The benchmark cost curve below shows the manufacturing cost of the new machine against other European machines producing the same product grade. The cost position of the new machine (virtual mill), considering the assumptions made for its operations and furnishes, is within the 3rd quartile, meaning it’s not competitive on cost.
 Source: FisherSolve
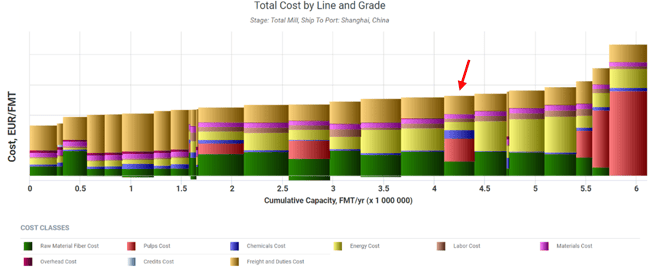
When including transportation costs to Shanghai, the 1st quartile mills become less competitive. By breaking down the manufacturing costs at the class level, we can see that purchased pulp and chemicals costs are driving the costs of the virtual machine up.
 Source: FisherSolve
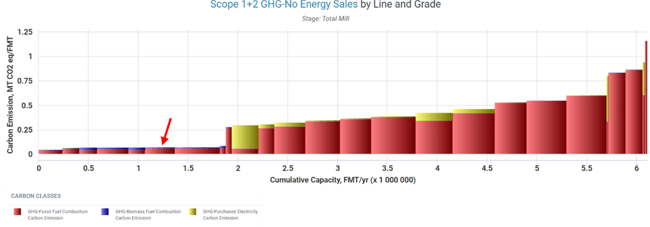
To round out our analysis, we evaluate greenhouse gas emissions for the virtual mill using our Carbon Benchmark module. The graph displaying Scope 1 + 2 emissions for the new machine versus its European counterparts shows that the new machine is among the lowest GHG emissions in the group. This is likely due to the selection of wastewood over fossil fuels as the energy source in the virtual mill, as well as internal generation of electricity.

Source: FisherSolve
Having access to such specific and crucial data, coupled with our exceptional consulting services, can help provide producers and major players the leverage needed to excel above and beyond competitors in this volatile industry. For more information on how our virtual mills can benefit your company, talk to an expert at Fisher today.


