US forest industry performance in July and August was recently reported by both the US government and the Institute for Supply Management.
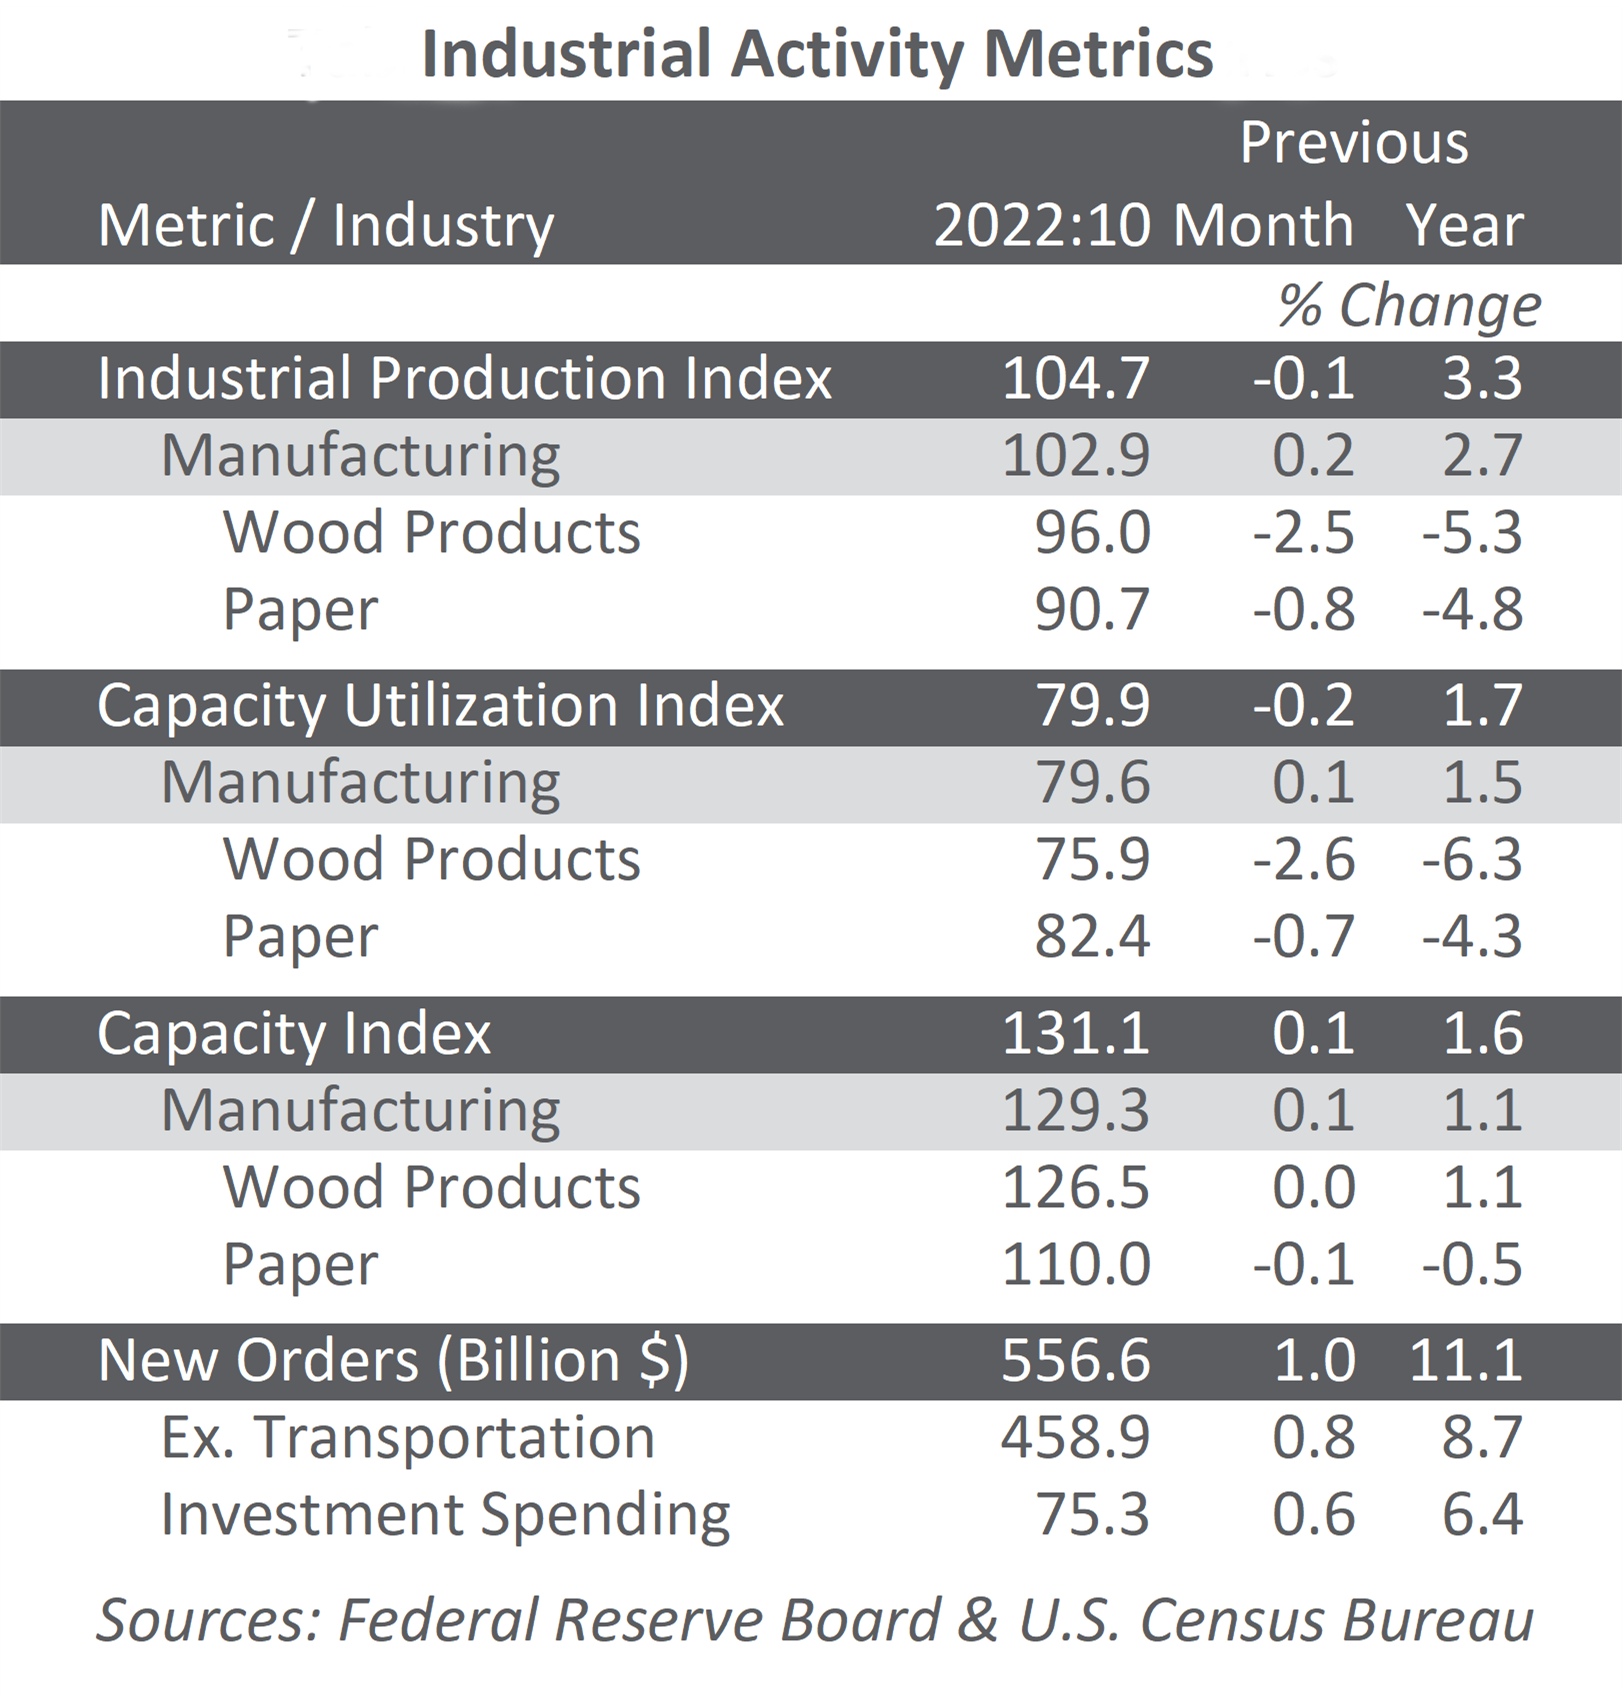
Total industrial production (IP) rose 3.0 percent in July (but -8.2 percent YoY) after increasing 5.7 percent in June; even so, the index in July was 8.4 percent below February’s pre-pandemic level. Manufacturing output continued to improve in July, rising 3.4 percent. Most major industries posted increases, although they were much smaller in magnitude than the advances recorded in June. Motor vehicles and parts registered the largest gain in July (+28.3 percent); factory production elsewhere advanced 1.6 percent. Mining production (mostly oil production) rose 0.8 percent after decreasing for five consecutive months, whereas the output of utilities increased 3.3 percent from demand for air conditioning.
New orders increased by an encouraging 6.4 percent (but -6.5 percent YoY). Durable goods orders jumped by 11.4 percent, led by transportation equipment; nondurable goods: +1.8 percent. Business investment spending edged up by 1.9 percent, and even nosed above year-earlier levels (+0.1 percent YoY).
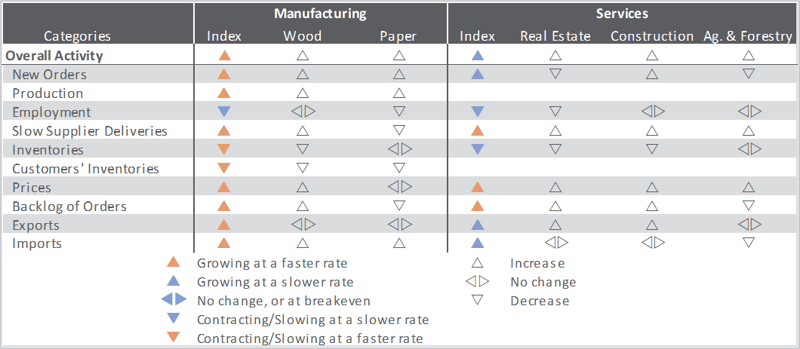
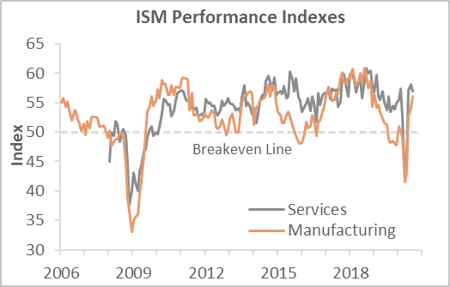
The Institute for Supply Management’s (ISM) monthly sentiment survey showed US manufacturing expanding more quickly during August. The PMI registered 56.0 percent, up 1.8PP from July’s reading. (50 percent is the breakpoint between contraction and expansion.) All of the sub-indexes reflected increased activity, although the pickup in slow deliveries and shrinking inventories suggest producers are struggling to bring product to market.
The services sector also expanded again, albeit at a marginally slower rate (-1.2PP, to 56.9 percent). The most noteworthy changes in the services PMI (formerly known as NMI) sub-indexes included new orders (-10.9PP), input prices (+6.6PP) and export orders (+6.5PP).
All of the industries we track expanded. Comments from respondents included:
- Wood Products: “Homebuilder business continues to be robust, with month-over-month gains continuing since May. Business remains favorable and will only be held back by supply issues across the entire industry.”
- Paper Products: “We are starting to see parts of our business rebound in August, while other parts remained weak. Some of our export business has come back for the first time since the start of COVID-19; however, domestic portfolios remain mixed.”
Findings of IHS Markit’s August surveys generally agreed with their ISM counterparts. “The manufacturing upturn gained further ground in August, adding to indications that 3Q should see a strong rebound in production,” wrote Markit’s Chris Williamson, although he observed the mix of new and export orders is creating “an unbalanced recovery in favor of larger firms.”
On the services side, “Surging inflows of new business... left [firms] struggling to meet demand,” Williamson continued. “The increase in backlogs of work bodes well for robust output growth to persist into September. However, the survey also highlights how the rebound is very uneven and the recovery path remains highly uncertain. Companies across the board also remain concerned about resurgent virus infections and the durability of demand in the coming months after the initial rebound potentially fades, with uncertainty over the Presidential election adding further risks to the outlook for many companies,” he concluded.
The consumer price index (CPI) increased 0.6 percent in July (+1.0 percent YoY)—one fourth of which was attributable to a 5.6 percent jump in the gasoline index. In addition, the index for motor vehicle insurance increased sharply (+9.3 percent) along with shelter (+0.2 percent), communication (+1.9 percent), used cars and trucks (+2.3 percent), and medical care (+0.5 percent). These increases were partially offset by decreases in the indexes for recreation (-1.2 percent) and food (-0.4 percent)—especially food at home (-1.1 percent).
The producer price index (PPI) followed its recent seesaw pattern by increasing 0.6 percent in July (-0.4 percent YoY)—the largest rise since October 2018. A 7.8 percent rise in the index for portfolio management was a major factor in the advance in prices for final demand services, whereas a 10.1 percent jump in gasoline prices dominated the final demand goods index.
In the forest products sector, index performance included:
- Pulp, Paper & Allied Products: +0.0 (+0.2 percent YoY)
- Lumber & Wood Products: +2.9 percent (+5.1 percent YoY)
- Softwood Lumber: +9.8 percent (+25.7 percent YoY)
- Wood Fiber: -1.7 percent (-3.6 percent YoY)