US forest industry performance in November and December was recently reported by both the US government and the Institute for Supply Management.
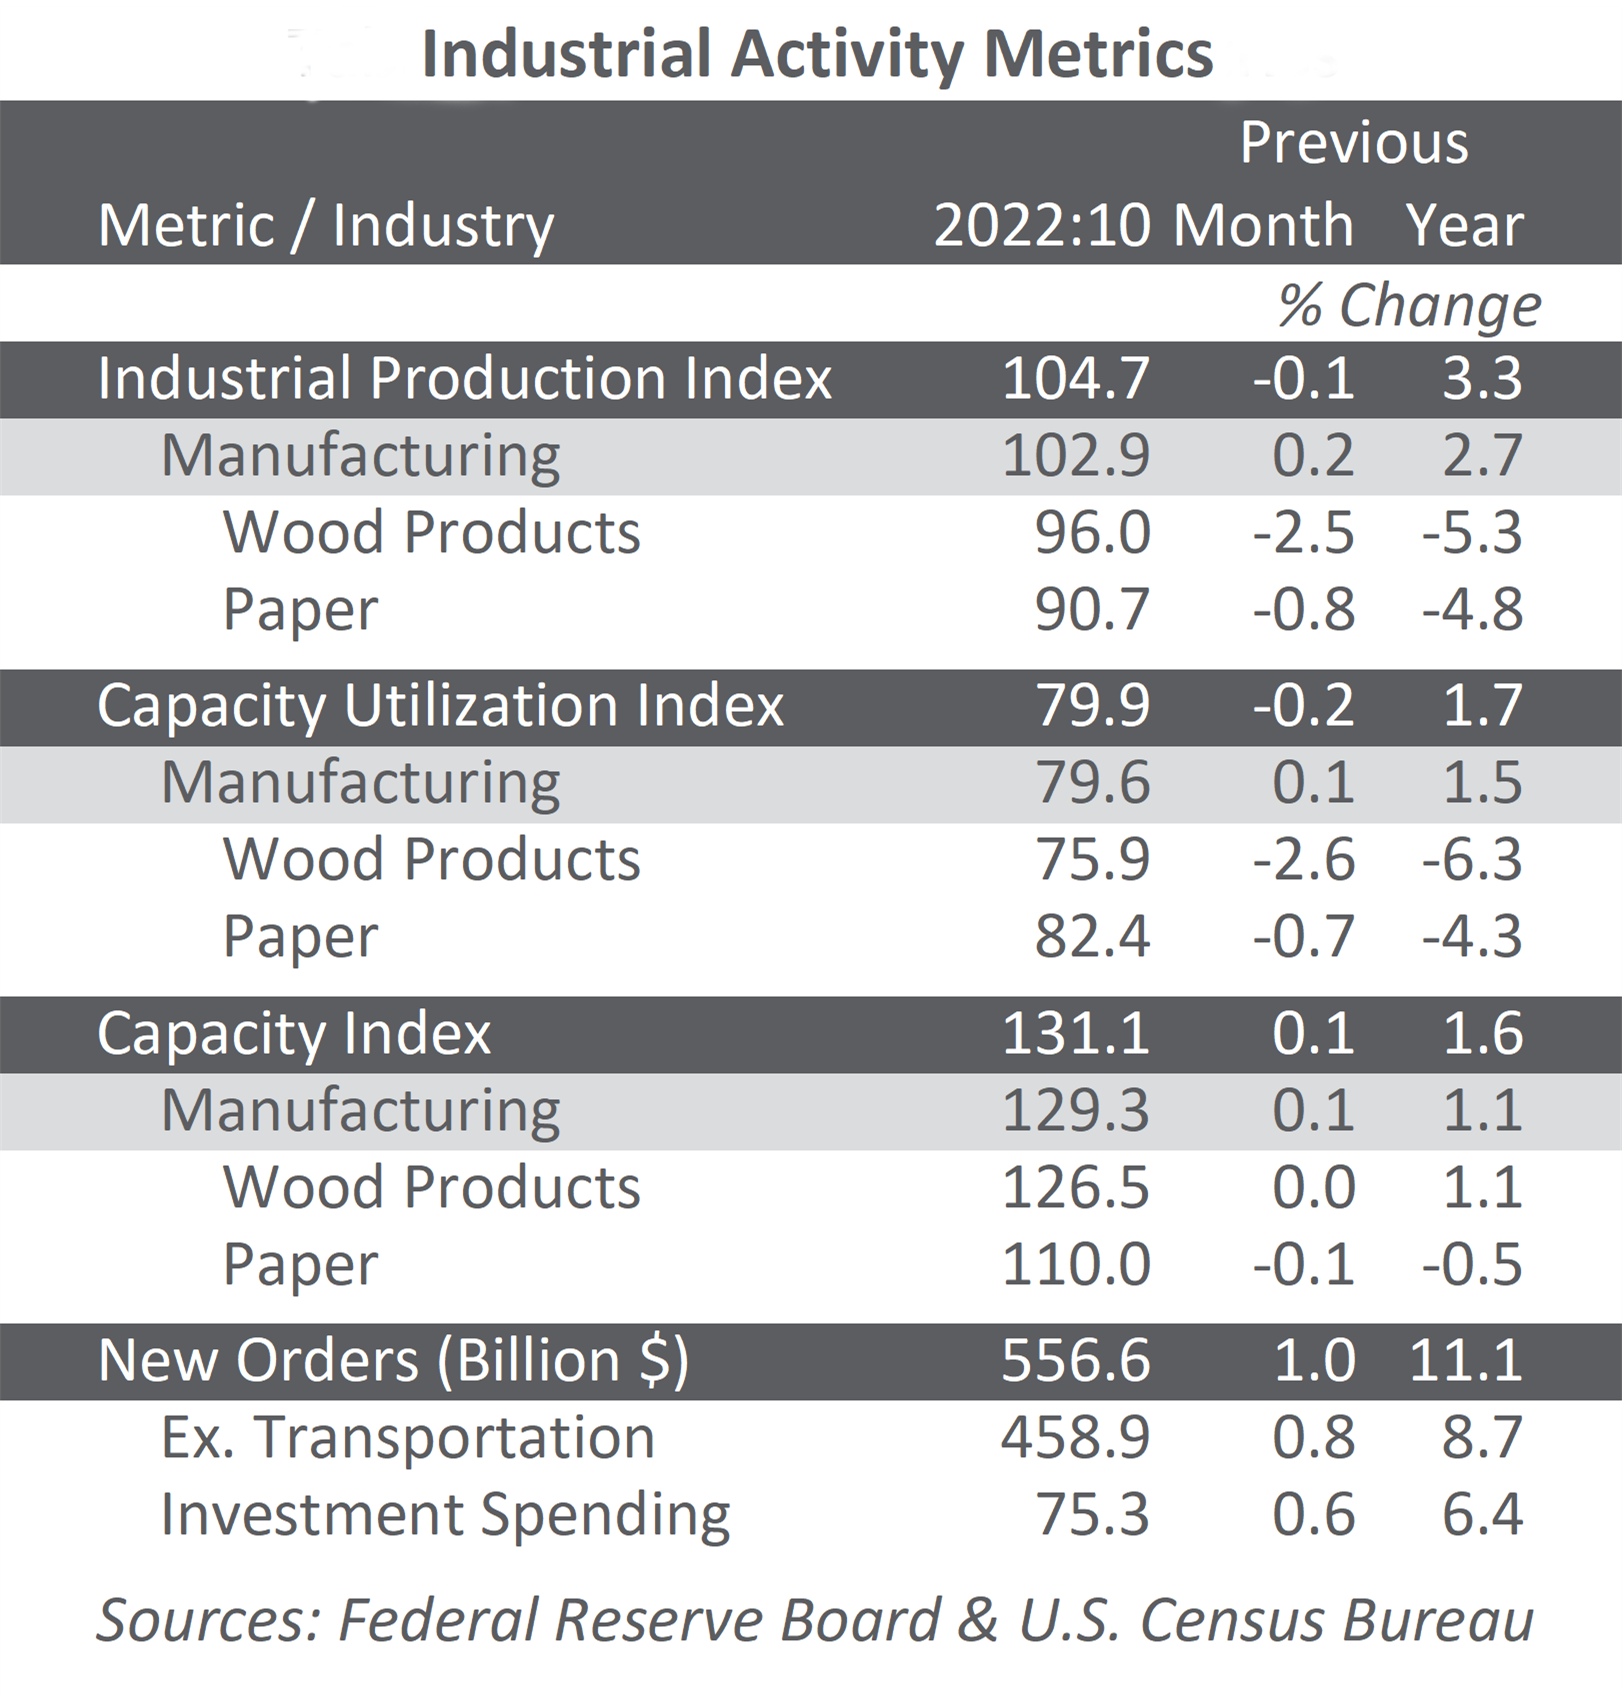
Total industrial production (IP) increased 0.4 percent in November (-5.05 percent YoY). After having fallen 16.5 percent February to April, the index has returned to about 5 percent below February’s pre-pandemic reading. In November, manufacturing output advanced 0.8 percent for its seventh consecutive monthly advance; motor vehicles and parts contributed half of the gain in factory production. The output of utilities declined 4.3 percent, as warmer-than-usual temperatures reduced the demand for heating. Mining production increased 2.3 percent after decreasing 0.7 percent in October.
Concurrently, new orders rose by 1.0 percent; excluding transportation: +0.8 percent. Business investment spending edged higher by 0.5 percent (+7.6 percent YoY). “The November data are signaling a slowing in momentum for both business investment and equipment spending,” wrote High Frequency Economics’ Rubeela Farooqi. “The manufacturing sector is not immune to surging virus cases and containment measures that could disrupt activity and weigh on demand going forward.”
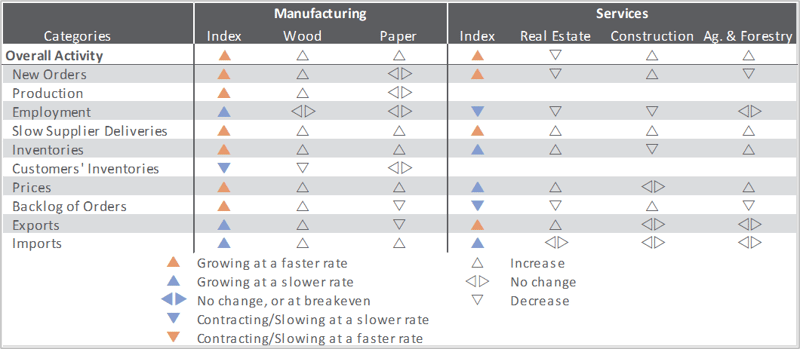
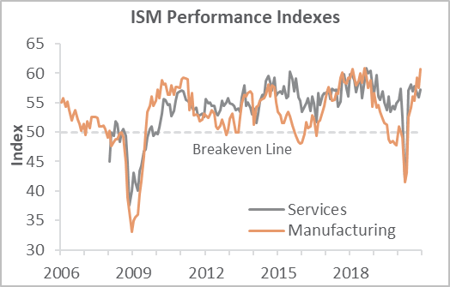
The Institute for Supply Management’s (ISM) monthly sentiment survey showed U.S. manufacturing expanding more quickly during December. The PMI registered 60.7 percent, up 3.2PP from the November reading. (50 percent is the breakpoint between contraction and expansion.) Rising values in the new orders (+2.8PP), production (+4.0PP) and employment (+3.1PP) sub-indexes buttressed that acceleration. An increase in slow deliveries likely also contributed to the headline increase, but we think the signal sent by that metric is prone to misinterpretation: Whereas slow deliveries often reflect pent-up demand when the economy is healthy, in this case the metric reflects supply chain disruptions in the context of still-meager demand. The 12.2PP jump in the input prices sub-index is perhaps the most disconcerting takeaway since it, too, reflects supply chain issues.
Of the industries we track, only Real Estate contracted. “Lack of labor continues to be a significant drag on the business,” wrote one Construction respondent. “We have plenty of work but are now considering rejecting some orders due to shrinking capacity.”
Findings of IHS Markit’s December survey results were about on par with their ISM counterparts, with operating conditions among manufacturers improving at fastest pace since September 2014 but services business activity growing at its slowest pace in three months thanks to the rise in virus cases.
“Manufacturers reported a strong end to 2020, with production and order books continuing to grow, albeit with the rates of expansion slowing as a result of rising virus case numbers and related restrictions,” wrote Markit’s Chris Williamson. “Producers of consumer goods reported a marked downturn in orders and production, reflecting weakened consumer expenditure amid the resurgence of COVID-19.
The consumer price index (CPI) increased 0.2 percent in November (+1.2 percent YoY). The increase was broad-based, with no component accounting for more than a quarter of the increase. The food index edged lower (-0.1 percent), whereas the index for energy rose because advances in indexes for natural gas (+3.1 percent) and electricity (+0.5 percent) more than offset a decline in the index for gasoline (-0.4 percent).
The producer price index (PPI) ticked up 0.1 percent (+0.8 percent YoY). The rise can be traced to a 0.4 percent increase in prices for final demand goods—particularly diesel fuel, which advanced 8.4 percent; by contrast, the gasoline index fell 1.9 percent. The index for final demand services was unchanged.
In the forest products sector, index performance included:
- Pulp, Paper & Allied Products: +0.3 percent (+2.2 percent YoY)
- Lumber & Wood Products: -5.1 percent (+13.3 percent YoY)
- Softwood Lumber: -18.3 percent (+37.2 percent YoY)
- Wood Fiber: -0.2 percent (+2.6 percent YoY)