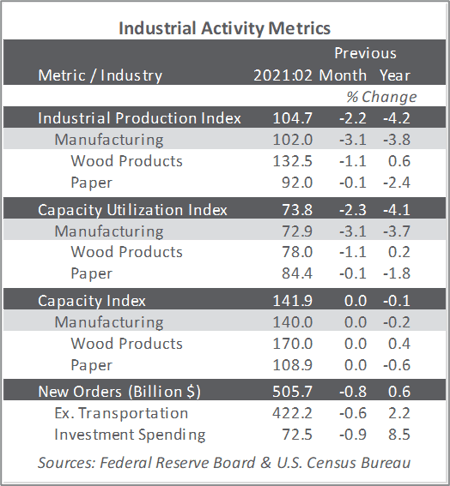
US forest industry performance in February and March was recently reported by both the US government and the Institute for Supply Management.
Total industrial production (IP) decreased 2.2 percent in February (-4.2 percent YoY). Manufacturing and mining fell 3.1 percent and 5.4 percent MoM, respectively; the output of utilities increased 7.4 percent.
Severe mid-February weather in southcentral states accounted for the bulk of the MoM declines. Some oil refineries and related “downstream” facilities suffered damage from the deep freeze and were offline for the rest of the month. Output of motor vehicles and parts dropped by 8.3 percent as a global shortage of semiconductors exacerbated the weather impacts. Had the winter weather not occurred, manufacturing might have fallen by only about 0.5 percent; mining: +0.5 percent. In any event, both indexes would have remained below their pre-pandemic (February 2020) levels.
The Institute for Supply Management’s (ISM) monthly sentiment survey reflected a jump in the proportion of U.S. manufacturers reporting expansion in March; the PMI registered 64.7 percent (the highest reading since December 1983), up 3.9PP from February. All but three sub-indexes posted higher readings, with employment (+5.2PP), production (+4.9PP) and slow deliveries (+4.6PP) being the most notable upticks; also, the input prices sub-index remained quite elevated.
The services sector PMI soared (+8.4PP) to an all-time high of 63.7 percent. The most noteworthy changes in the sub-indexes included new orders (+15.3PP) and business activity (+13.9PP); the input prices sub-index also hit 74.0PP—the highest reading since June 2008.
Of the industries we track, only Wood Products did not expand. Respondents included the following:
- Construction: “Residential new home construction demand continues to outpace supply. Building material delays, discontinuations and shortages are beginning to develop. Shipping delays at the L.A. and Long Beach ports have contributed to longer lead times. Cold weather in Texas has hurt several component manufacturers for building materials. We have encountered the ‘perfect storm’ for building material shortages and price increases.”
- Real Estate: “Business is picking up as mandated restrictions seem to be easing and spring is right around the corner.”
Findings of IHS Markit’s March survey results were consistent with their ISM counterparts.
“March saw manufacturers struggle to cope with surging inflows of new orders,” observed Markit’s Chris Williamson. “Although output continued to rise at a solid pace, capacity is being severely strained by the combination of soaring demand and supply chain disruptions: supply chain delays and backlogs of uncompleted orders are growing at rates unprecedented in the survey’s 14-year history, meaning inventories of finished goods are falling at a steep rate.
“Pricing power has risen accordingly as demand outstrips supply: raw material prices are increasing at the sharpest rate [in] a decade and factory gate selling prices have risen to a degree not seen since at least 2007.
“With business expectations becoming even more optimistic in March, further strong production growth looks likely in 2Q,” Williamson concluded; “but the big question will be whether rising price pressures also become more entrenched.”
The consumer price index (CPI) increased 0.4 percent in February (+1.7 percent YoY). The gasoline index rose 6.4 percent, accounting for over half of the MoM increase in the all-items index. The electricity and natural gas indexes also increased, and the energy index rose 3.9 percent over the month. The food index rose 0.2 percent in February, with the index for food at home and the index for food away from home both rising.
Meanwhile, the producer price index (PPI) increased 0.5 percent in February (2.8 percent YoY, the largest increase since October 2018’s +3.1 percent). Most of the MoM advance can be traced to a 1.4 percent rise in the index for final demand goods—especially a 13.1 percent jump in the gasoline index. Prices for final demand services increased 0.1 percent.
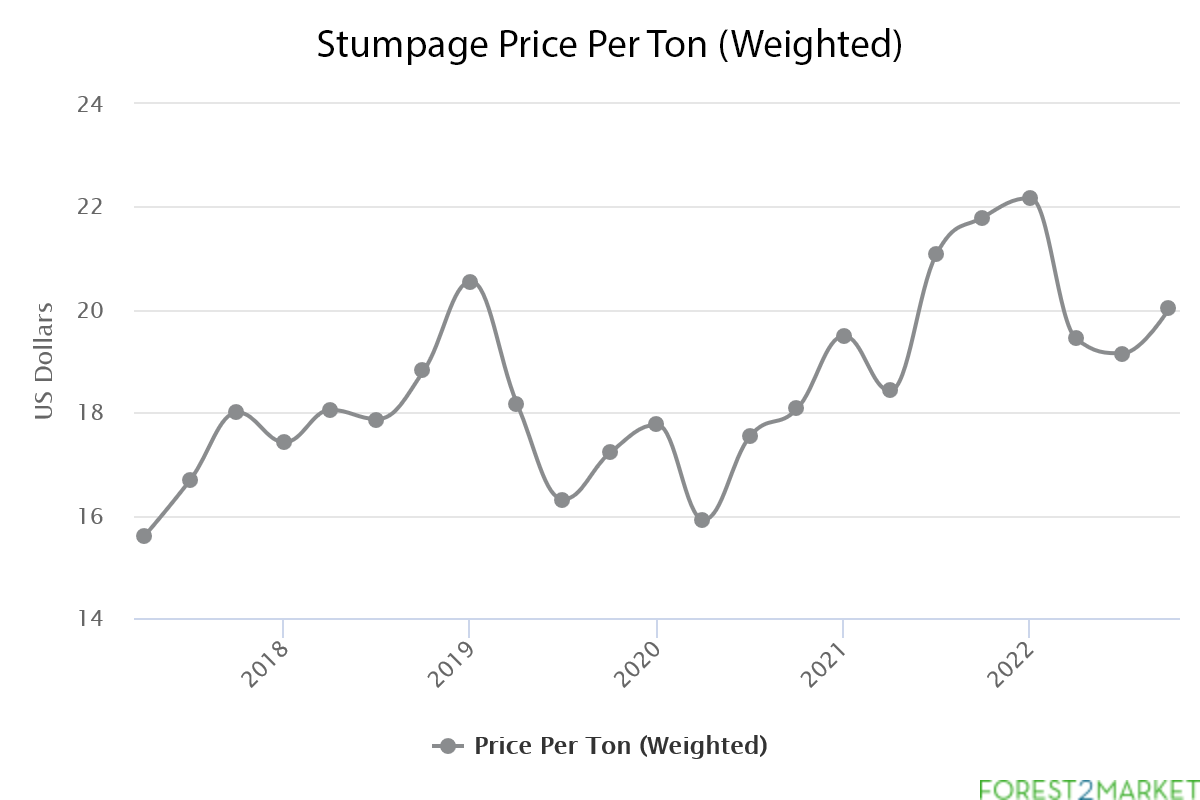
In the forest products sector, index performance included:
- Pulp, Paper & Allied Products: +1.0 percent (+5.1 percent YoY)
- Lumber & Wood Products: +2.9 percent (+25.1 percent YoY)
- Softwood Lumber: +7.9 percent (+79.7 percent YoY)
- Wood Fiber: +0.4 percent (+8.6 percent YoY)