Forest2Market’s newest analytical tool – Carbon Analysis 360 – was specifically designed to help participants across the forest value chain better understand the important ways in which they can impact climate concerns, inform decision-making, and identify new opportunities in developing markets. This data can help identify critical trends that will impact climate initiatives going forward, and it can also help stakeholders answer important questions to better understand how forest management regimes can impact forest carbon stores.
In this post, we will use Carbon Analysis 360 to help answer one of these important questions:
Where is the largest forest carbon pool in the contiguous US?
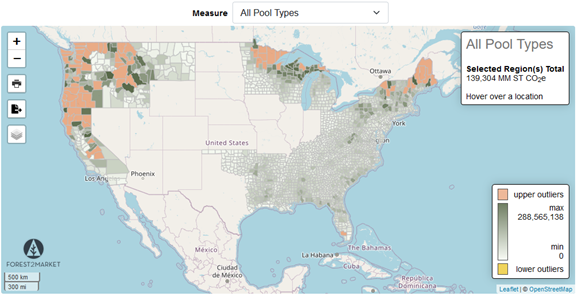
This is a pretty straightforward question but the answer requires context, and some of the nuances are unique to forest diversity inherent to different regions. At a landscape level, the primary forested regions of the contiguous US—Western North America (including the Pacific Northwest [PNW], US South, and Eastern North America (Lake States and Northeast)—store over 139 billion US tons of Carbon Dioxide Equivalent (CO2e).
Looking at total CO2e stored in all carbon pool types in the map below, we can see clusters of orange (counties that are upper outliers) sprinkled across the country. There is a dense concentration in the PNW, and less dense representations in both the Lake States and the Northeast.
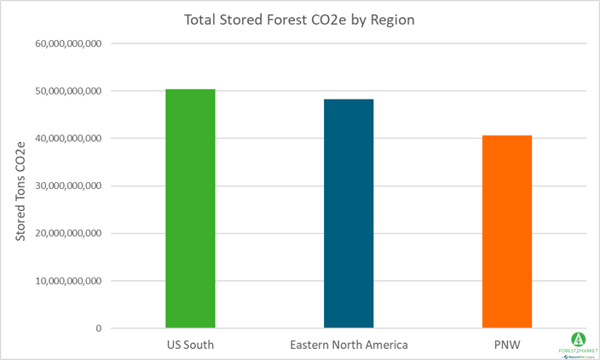
However, when we look at total volume of carbon stored across the three distinct regions, the US South edges out the others as the largest carbon sink because it is the largest forested area by total acres. But that doesn’t tell the whole story.
When we adjust the visualization to view carbon stored in all pool types by acre—a more accurate representation of how forests perform as regional carbon sinks—the data tell a somewhat different story. Eastern North American forests store the most CO2e per acre (329 tons), while the US South stores the least amount (233 tons).
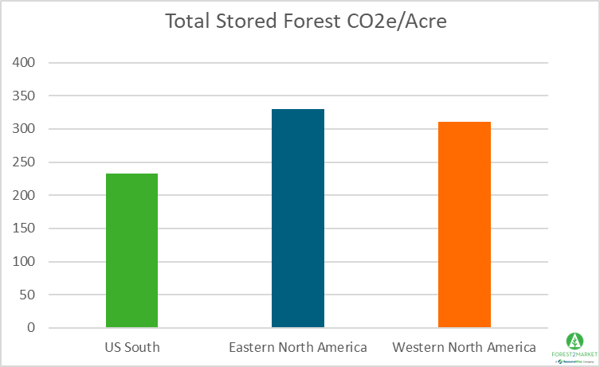
While these regional differences aren’t extreme, a primary reason for the discrepancy is the fact that forests in the Northeast and Lake States are packed with large, dense hardwood species, which typically store more carbon than the coniferous tree species that dominate Southern working forests.
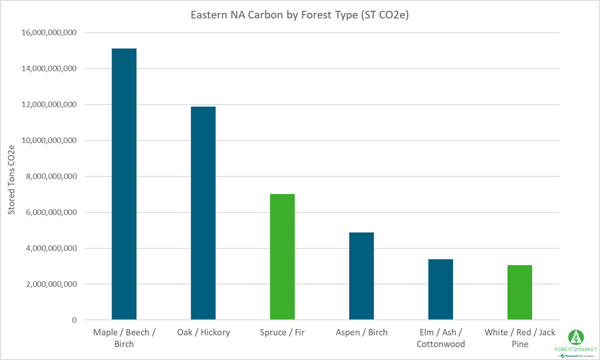
These differences cut to the essence of America’s forested regions and the diverse makeup of the individual forests that comprise them. Context is important here, because there are dramatic differences between forest stand densities, as well as innate variations in deciduous and conifer tree species and sizes, the average dry tree weights of each (dry tons of biomass per species, per tree), and myriad other factors that impact a forest’s ability to store carbon.
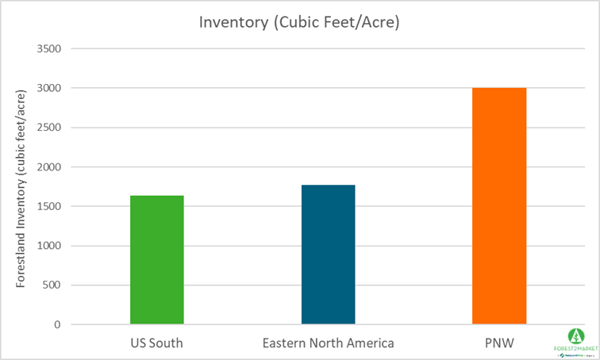
One method to simplify some of these variables is to analyze tree inventory per acre of forestland across the three regions, which gives us yet another result. (It’s important to recognize that tree inventory does not represent the number of individual trees in a given area, but rather the total volume of aboveground tree biomass expressed in cubic feet.) When we look at this data, the PNW clearly beats out the other two regions in terms of total forest inventory/acre.
When we investigate the data on a sub-regional level, most of the stored carbon appears to be distributed throughout the primary forested area—in this case, the area west of the Cascade Mountains (“Westside”).
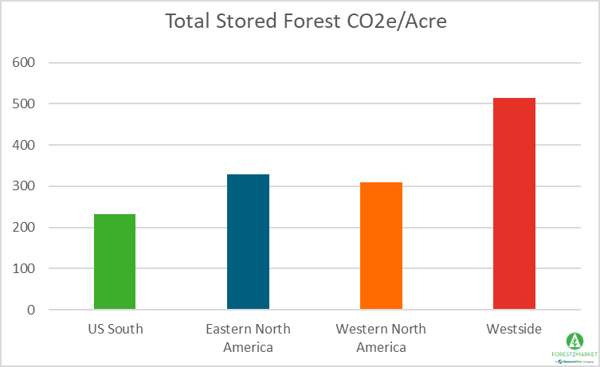
On the whole, the Westside stores nearly 14 billion tons of CO2e, or 514 tons/acre. For broad comparison purposes, the entire state of North Carolina—which has a robust combination of both working and non-working forest resources—stores roughly 5 billion tons of CO2e at 282 tons/acre.
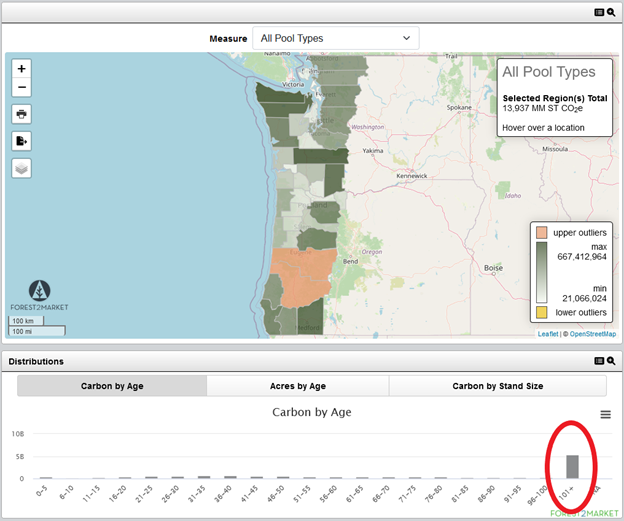
This intuitively makes sense when we look at some of the detail around species differences, inventory, stored carbon per acre and trends by age class. In the case of the Westside above, notice a vast majority of the stored CO2e/acre is in trees that fall into the 101+ year age class. This reflects the high percentage of National Forest and other federal- and state-owned land in the area, most of which is unavailable for commercial timber harvesting.
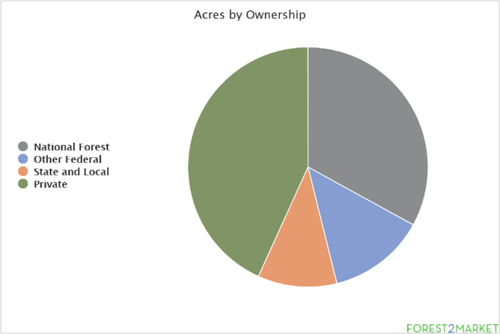
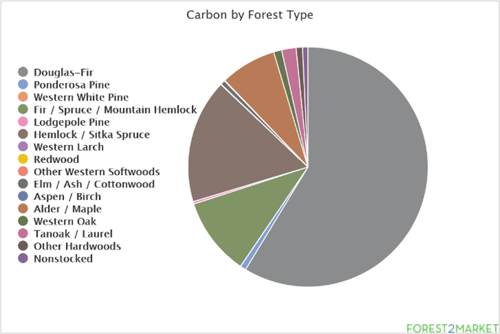
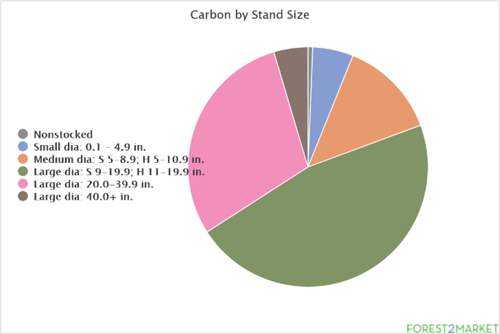
The region is also stocked with a significant amount of very old—and very large—Coast Douglas-fir and Hemlock trees that are capable of storing a considerable amount of carbon. In the chart below, notice that a vast majority of the forest carbon stored in the Westside is in large diameter trees. These forests provide a tremendous environmental benefit since they are able to store lots of carbon on a smaller “footprint,” but as always, there are caveats that are unique to different geographies and the lifecycle of their forests.
For those thinking, “We can just plant Doug-fir trees all across the US and effectively create a sustainable carbon sink to mitigate climate change,” the reality is not so simple. Coast Doug-firs thrive in the climate and geography of the PNW; they can’t be planted in coastal North Carolina, for instance, and flourish in the same way. The vast diversity in US forest resources is what makes each region and individual carbon sink so special and, as is the case with all natural resources, there are inherent limitations.
A major unintended consequence of the reactionary legislation passed in the PNW in the 1980’s has been a drastic overgrowth of timber, and a buildup of dead/decaying trees that become dangerous fuel for wildfires. These wildfires release carbon emissions that affect everything from regional forests to the global climate, and they drive climate change-related events that contribute to even more wildfires.
In 2020 alone, nearly 11 million acres of forests burned in the PNW at tremendous social and financial costs. To put the carbon emissions from these events into perspective, the 2020 wildfires in California alone generated nearly 100 million metric tons of carbon dioxide emissions, which is roughly 30 million tons more CO2 than the state emits annually from power production! That number is also equal to half of the total carbon stored in Humboldt County, CA forests, which are densely populated with gigantic, majestic Sequoias.
So, which US region stores the most carbon?
As it turns out, the seemingly straightforward answer to our original question is not so straightforward after all. Depending on what characteristic of forest carbon reporting we want to measure and how we want to analyze the data, all three forested regions are “winners” in their own unique ways, and all three play an essential role in sequestering carbon emissions.
Carbon Analysis 360 provides unparalleled insights—in a user-friendly interface—into the forest carbon datasets that are poised to drive decision-making going forward. Users have the flexibility to analyze the forest carbon metrics that matter most to them, and all of the unique platform data can be further refined down to the county level, as well as downloaded and exported. Talk to a Forest2Market representative today to arrange a demo.


