When we look at the capacity trends module in Fisher International’s FisherSolve business intelligence platform, we can see that the top five countries with the largest compounded annual growth rate (CAGR) for pulp and paper production capacity between 2013-2021 include Laos, Myanmar, Turkmenistan, Armenia, and Kenya. While this doesn’t necessarily mean these countries are producing the most capacity compared to all the other countries, it does mean that over the last eight years, they have experienced the most significant growth based on their prior production capacities.
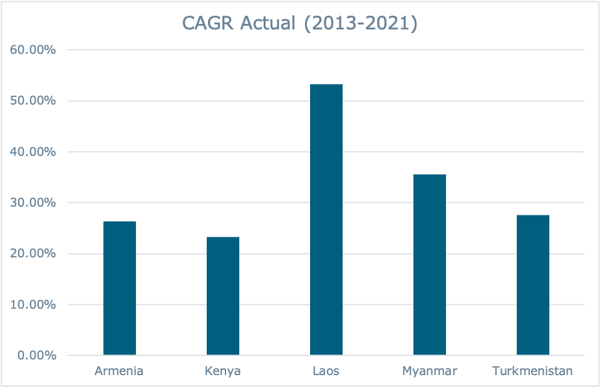
Source: FisherSolve
Capacity in Laos was flat from 2013-2017 until it began to increase in 2018. Compared to 2013, Laos added over 978,000 tonnes of capacity in 2021 - a 2,944% increase. The other countries listed above experienced similar growth, with Myanmar experiencing +1,037% growth in 2021 compared to 2013, Turkmenistan +600%, Armenia +547%, and Kenya a +435%. This prompts us to wonder: What factors have influenced this growth, and what grades experienced the most growth?
When we take a closer look at the trend data, containerboard is the top grade of added capacity in 2021 for four of the five countries we examined – it was the second largest grade produced in Turkmenistan. As we can see in the image below, containerboard makes up 59% of capacity between these five countries, with market pulp following behind at 39%, and the other grades each making up less than 5%.
2021 Capacity by Major Grade in Armenia, Kenya, Laos, Myanmar, and Turkmenistan
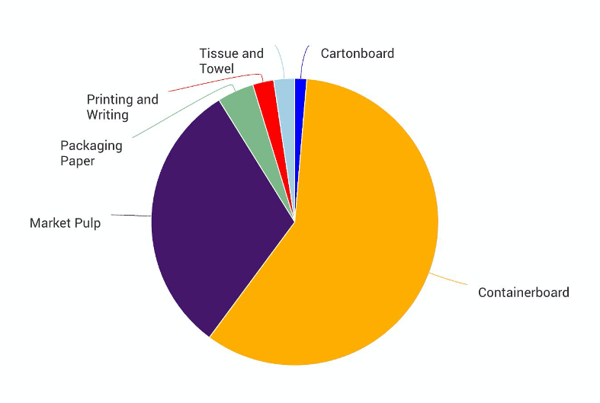
Source: FisherSolve
For those monitoring the containerboard sector, this makes sense considering the monumental surge e-commerce, and consequently the containerboard sector, has experienced globally since the onset of the pandemic in 2020. Additionally, containerboard demand has also increased due to growth in consumer demand for sustainable paper products – which the P&P industry has been investing in to meet these evolving needs. Paper products and materials like containerboard help consumers seeking sustainable choices meet their ESG goals as these are some of the most-recycled materials in the US.
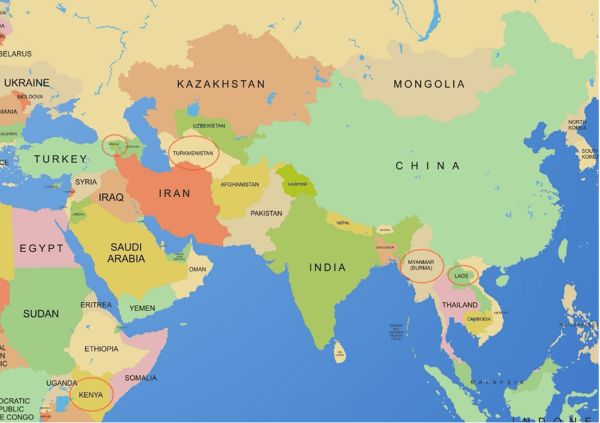
The evolving dynamic between the increasing momentum of sustainability-related initiatives and the growth in demand for more packaging has created a huge opportunity for the containerboard sector. However, this isn’t the only reason these countries have experienced significant capacity growth. When we look at a map, we can see that Laos, Myanmar and Turkmenistan are neighboring countries to China, and some of China’s recent legislation has fueled this trend.
In 2017, China implemented a recovered paper (RCP) policy, which banned unsorted waste paper imports — disrupting markets globally. The new change began to reshape the whole supply chain throughout Asia, the Americas and Europe— from waste collectors to paper producers. China implemented this ban as an attempt to protect both environmental resources and its citizens’ health from the high contamination levels that were occurring due to the poor quality of recycled paper.
As a result, OCC (a major type of RCP used in containerboard production) was heavily impacted as the import licenses of many Chinese mills did not comply with the environmental standards and were ultimately revoked, significantly reducing imports of OCC from the US and EU. Then, at the beginning of 2021, Chinese OCC imports were completely banned, which had an impact on the volume of total imports of different paper grades. As a result, this presented a large opportunity in many of the neighboring countries to invest in the equipment and machinery needed to make up for this loss – which explains the huge jump in growth for the countries discussed.
After looking at the impact China’s ban on RCP has had on various countries and their CAGR for pulp and paper production capacity, it’s important to address a number of peripheral questions:
- Will we see this trend replicate itself if other countries impose similar bans?
- What impact will this have on future export and import trends?
- Will these countries maintain their capacity growth or plateau?
- What other countries will be in the ‘top 5’ list of producers five years from now?
In such a volatile industry, it’s important to access robust datasets and practical insights to anticipate market shifts. Fisher International offers unparalleled data services and consulting services that allow innovative and forward-looking companies to identify new opportunities that drive business success. Talk with one of our experts today.