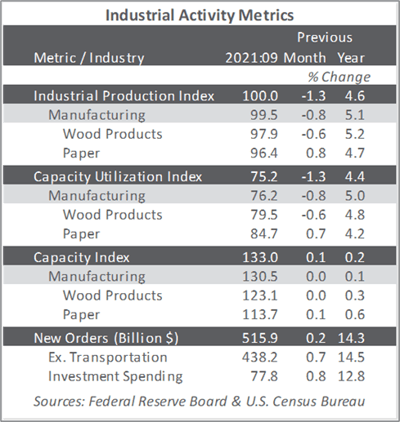
Following a -0.5PP revision to August’s data (to -0.1 percent MoM), total industrial production (IP) fell another 1.3 percent in September (but +4.6 percent YoY). Manufacturing output decreased 0.7 percent, led by continued computer-chip shortages that caused motor vehicles and parts to fall by 7.2 percent; factory output elsewhere declined 0.3 percent. Utilities dropped 3.6 percent, as demand for cooling subsided after a warmer-than-usual August, while mining production fell 2.3 percent.
The lingering effects of Hurricane Ida more than accounted for the drop in mining in September; they also contributed 0.3PP to the drop in manufacturing. Overall, about 0.6PP of the drop in total IP resulted from the impact of the hurricane.
Despite September’s MoM decrease, total IP rose 4.3 percent (annualized) for 3Q as a whole, its fifth consecutive quarterly gain of at least 4 percent. The highlight of the report was business investment spending, which increased by 0.8 percent (+12.8 percent YoY). The weakness in overall orders is entirely due to supply constraints, said Capital Economics’ Michael Pearce—who does not expect the situation to improve significantly over the next couple of quarters.
The Institute for Supply Management’s (ISM) monthly sentiment survey showed a slight decrease in the proportion of US manufacturers reporting expansion in October. The PMI registered 60.8 percent, a decline of 0.3PP from the September reading (50 percent is the breakpoint between contraction and expansion).
The services PMI jumped to a new high (+4.8PP, to 66.7 percent). Input prices (+5.4PP), slow supplier deliveries (+6.9PP), and order backlogs (+5.4PP) all posted record-high readings while inventory sentiment (-9.0PP) dropped to a record low. These outcomes are expressed in the survey’s headline as expansionary because such moves typically occur when demand is strong; in this case, however, they are associated with supply chain disruptions.
Of the industries we track, only Wood Products contracted. Respondent comments included the following:
- Construction: “Supply chain disruptions continue to roil new residential construction. Material and skilled labor shortages are lengthening cycle times and forcing substitutions.”
- Real Estate: “Construction remains quite strong, although material supply issues persist.”
IHS Markit’s October survey headline results were largely consistent with their ISM counterparts. “The final PMI data add to indications that the US economy has picked up speed again in 4Q,” wrote Markit’s Chris Williams. “After the Delta variant caused growth to slow in 3Q, the easing of virus case numbers has been followed by a strong revival of economic activity, notably in the service sector, which looks set to be the driving force of the economy as we head towards the end of the year.”

The consumer price index (CPI) increased 0.4 percent in September (+5.3 percent YoY, a 30-year high) after rising 0.3 percent in August. The indexes for food and shelter rose in September and together contributed more than half of the MoM increase. The cost of rent jumped 0.5 percent, marking the biggest increase in 20 years; this is something we have been warning about recently, and is likely to continue exerting upward pressure on CPI for a number of months. The index for food rose 0.9 percent; grocery prices have climbed 4.5 percent in the past year and are increasing three times faster than they did in the five years before the pandemic. The energy index increased 1.3 percent, with the gasoline index rising 1.2 percent.
Concurrently, the producer price index (PPI) decelerated to +0.5 percent (+8.6 percent YoY), the slowest MoM gain since December 2020. Nearly 80 percent of September’s increase can be traced to a 1.3 percent rise in prices for final-demand goods, led by gasoline (+3.9 percent). The index for services moved up 0.2 percent, driven by an 11.6 percent jump in margins for fuels and lubricants retailing.
One anomaly in the PPI data is a 4 percent drop in the cost of transportation and warehousing. With ports backed up, truckers hard to find, limited space on rail cars, and major shippers raising prices, “[that result] has no basis in reality,” said MFR’s Joshua Shapiro.
In the forest products sector, price index performance included:
- Pulp, paper & allied products: +0.6 percent (+13.7 percent YoY)
- Lumber & wood products: -4.3 percent (+2.5 percent YoY)
- Softwood lumber: -4.3 percent (-31.4 percent YoY)
- Wood fiber: -0.2 percent (+12.2 percent YoY)


