Turkey’s tissue business is often discussed quite frequently, reflecting its growing economic focus on tissue exports and position as a bridge between Europe and the Near East. In addition, Turkey’s cultural influence from the Muslim Ottoman Empire over more than 600 years enables the country to influence modern tissue consumers in regions beyond the reach of Europe or North America.
Many economic factors affecting Turkey’s economy and business remain the same – high inflation, unemployment, and weakness in its currency (Lira). However, many things have since changed.
A new land war in Eastern Europe thrust Turkey into the roles of diplomat and gatekeeper to the Black Sea. This war has dramatically upset global energy prices that are still changing tissue economics as countries move back to coal and ahead to alternative green energy sources. Turkey has also been renamed “Türkiye” to reflect its language better and differentiate it from the North American bird misnamed four centuries ago by London fowlers to make it sound more exotic.
While the onset of the global Covid-19 pandemic disrupted many economies all over the world, Turkey fared rather well economically through the pandemic, with a jump in GDP per person in 2021, as shown in Figure 1. The population also continues to grow at an estimated rate of 0.67% in 2022 – a slow growth that is ahead of most of Europe and North America. These factors will continue to support domestic tissue demand with a growing consumer base and spending power.
Figure 1: Turkey's Population and per Capita GDP
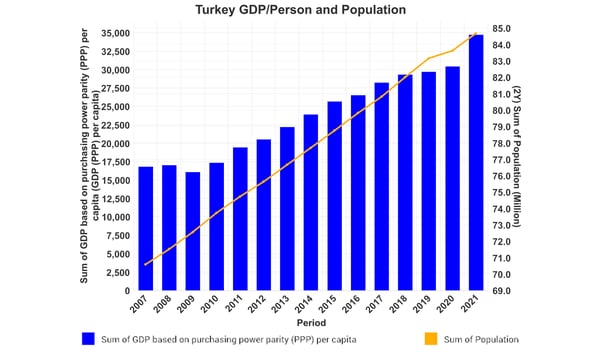
Source: FisherSolve
Figure 2, however, presents a less optimistic view of the economy as inflation started to cool in 2020, only to reignite in 2021. 2022 is expected to be much worse too as unemployment remains elevated. These factors have created a stressed economy in Turkey, affecting tissue exports and market pulp purchases made with the devalued Lira. Turkey relies on imported energy, but has some domestic energy sources including coal, oil, and gas. The new Turkish-Azerbaijani Trans-Anatolian gas pipeline is helping diversify energy sources and provide some protection from energy price shocks.
Figure 2: Turkey's Inflation and Unemployment
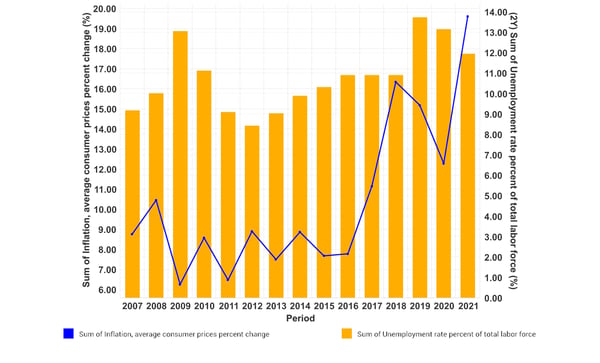
Source: FisherSolve
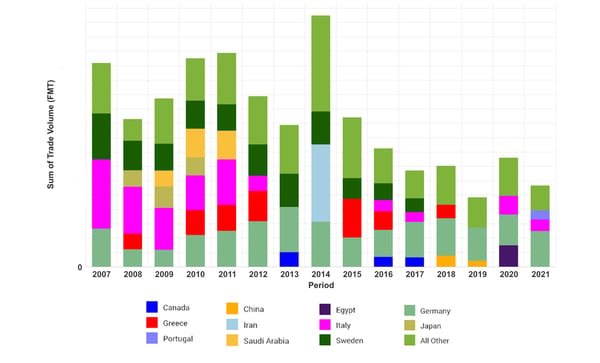
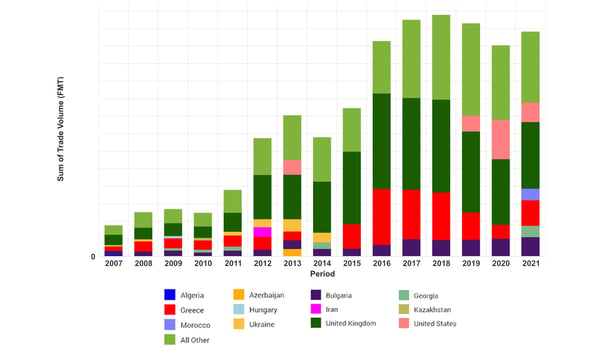
Turkey’s tissue imports and exports are shown in Figures 3 and 4. Based on 2021 data, Turkey exports more than five times the amount of tissue it imports. Each trade partner country with a greater than 5% share is shown to identify key trading partners. Germany, Italy, and Portugal were the leading tissue suppliers in 2021, as shown in Figure 3. Figure 4 on the other hand shows the tremendous growth of tissue exports since 2007, with the United Kingdom continuing to be Turkey’s largest customer, followed by Greece, the United States, and Bulgaria.
Figure 3: Turkey's Tissue Imports
Source: FisherSolve
Figure 4: Turkey's Tissue Exports
Source: FisherSolve
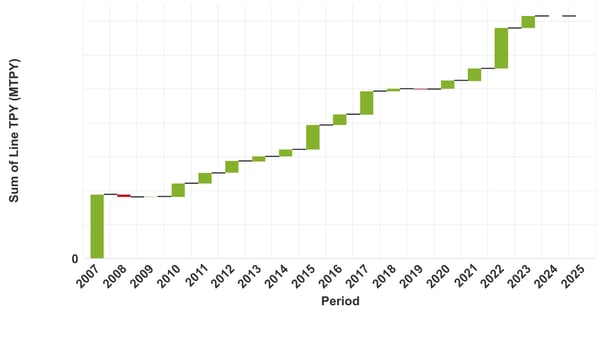
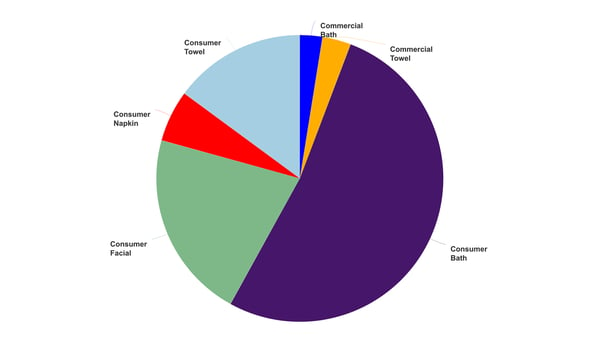
Turkey’s tissue producers have continued to implement a disciplined approach to capacity expansion, as shown in the waterfall chart in Figure 5. This chart shows the number of machines added (represented as the green bars) and the number of removed machines (represented as the red bars). Fisher International forecasts that three more machines will be removed from service in 2023 with one more shutdown in 2024. The net result is fewer machines but more capacity and efficiency for the Turkish tissue business. Turkey’s tissue production continues to focus on consumer grades of bath, facial tissue, and towels to support both export and domestic demand, as shown in Figure 6. Again, this is very similar to what we’ve observed in previous reports.
Figure 5: Turkey's Tissue Machine Additions
Source: FisherSolve
Figure 6: Turkey's Tissue Products
Source: FisherSolve
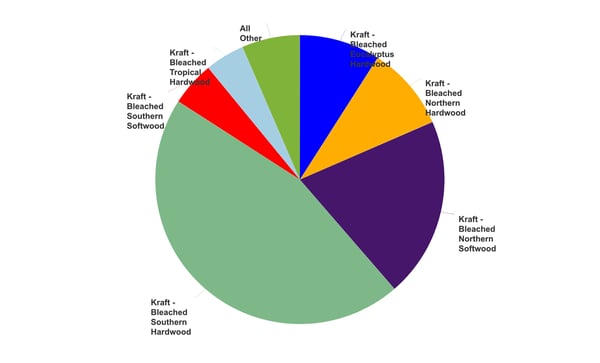
About one-quarter of Turkey’s tissue-producing sites have some recycled fiber integration. Still, the total deinked and non-deinked fiber is only about 6% of the tissue fiber consumed. Figure 7 shows the breakdown of fiber sources, including southern and northern hardwood and softwood pulps, and Eucalyptus and tropical hardwood. As we can see, the most common pulp is southern hardwood.
Figure 7: Turkey's Tissue Fiber Sources
Source: FisherSolve
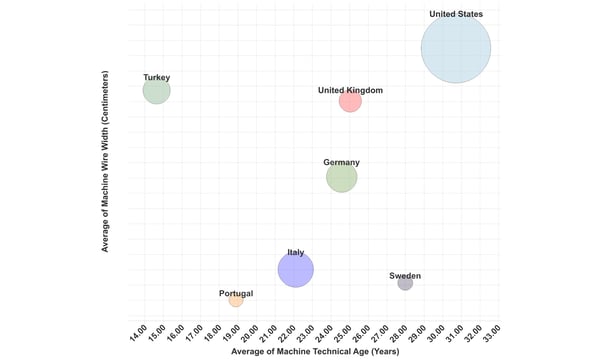
A comparison set of tissue countries was assembled to include some of Turkey’s tissue suppliers and customers to facilitate an analysis of Turkey’s competitive strength. Figure 8 shows the average tissue machine technical age (X-axis) and wire width (Y-axis) for each country in the selected competitive set. The bubble size for each country is proportional to the total volume of that country’s tissue production. The country has the newest tissue fleet measured by average technical age. The average width of its tissue machines is similar to the United States and the United Kingdom. The other tissue machine quality measured to indicate productivity is line speed. Turkey also wins this race, with only Germany in a close second.
Figure 8: Turkey's Trade Group Tissue Machine Quality
Source: FisherSolve
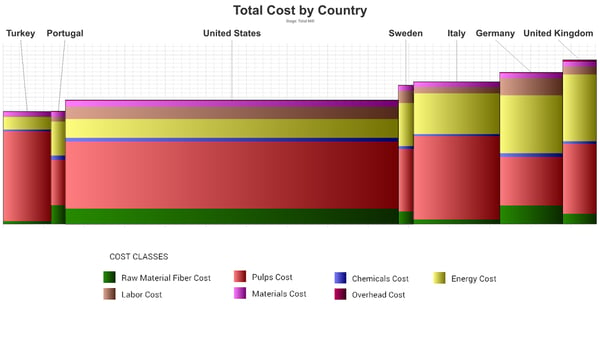
Figure 9 shows Turkey has the lowest cash cost position in the selected competitive set, with Portugal close behind and Germany and the United Kingdom possessing the highest average costs. The stacked bars indicate that energy costs are higher for Germany and the UK.
Figure 9: Turkey's Trade Group Cash Cost per Tissue Ton by Country
Source: FisherSolve
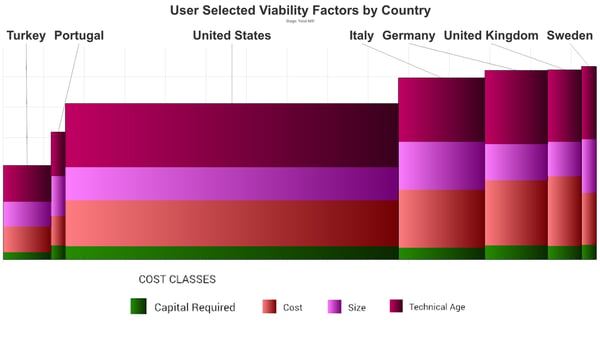
Figure 10 shows the FisherSolve calculated viability for the same competitive set. Viability analysis includes the cost position of Figure 9 plus technical age, capital required, size, and competitiveness. On average, this analysis shows that Turkey is the most viable of the shown countries.
Figure 10: Turkey's Trade Group Viability Analysis by Country
Source: FisherSolve
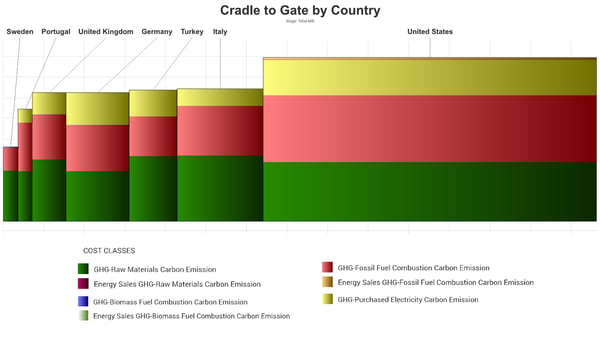
Average tissue business position in carbon emissions is shown in Figure 11. The country ranks in the middle of the pack for most of the European-producing countries selected, with Sweden being the lowest carbon emission producer of this set. The purchased electricity component is missing from Sweden, suggesting the use of renewable energy for electricity production. The United States is always the outlier when included in the analysis. It has enjoyed low energy costs (by global standards) and avoided the market drive to energy efficiency. It also makes the most significant proportion of ultra-soft tissue that requires more drying.
Figure 11: Turkey's Trade Group Total Carbon Emission per Ton of Tissue by Country
Source: FisherSolve
Despite Turkey’s currency and inflation problems, the tissue business continues to be poised to survive and thrive. The high cost of imported fiber in local currency seems to be under control and the new tissue capacity provides excellent commercial viability for the future. In addition, disciplined tissue machine replacements have made Turkey competitive without oversupplying the market.
Analysis of competitive position requires specifics on tissue producers and individual machines. This article presents a static picture summary of Turkey’s tissue industry today. Fiber prices, exchange rates, and environmental regulations will change, providing some participants with advantages and others with new challenges. Turkish tissue mills will continue to change hands and perhaps consolidate; neighboring countries may invest in tissue-making capacity, thus affecting Turkey’s imports and exports.