In a time of extraordinary price disruption, 26 of France’s 56 aging reactors are offline for maintenance and 18 are down with labor strikes. The country’s previous cost and carbon footprint advantage has been eroded, the resilience of the nuclear grid remains a concern, and tough choices lie ahead.
If we were to look at France's tissue business in 2019, some of our conclusions would have noted a good position for France as a domestic producer in the near term with a small number of net imports to balance exports and excess demand; the carbon emissions from French tissue production were noticeably lower than neighboring countries due to the high percentage of carbon-free nuclear power-generated electricity; French tissue machines tended to be fast but somewhat older, and labor costs were higher than other western European tissue producers.
However, this report will find a much different economic environment than any previous analysis. As we all know, Covid-19 hit the global manufacturing economy and the associated supply chain very hard. A recovery was underway in the second half of 2021, only to be dislocated in February 2022 by the land war in Ukraine and the disruption of energy supplies to western Europe. This report will look at the relative resilience of French tissue producers compared to neighboring countries’ tissue industries.
Analyzing tissue demand starts with population growth and disposable income. Figure 1 shows the population growth as a line and GDP as adjusted per capita purchasing power to indicate the size and buying power of the domestic market. France’s population continues to grow at about 0.32% a year (2022 estimate) after a slight inflection in 2015, showing a small growth rate decrease. This is relatively low growth in the world but better growth than some of France’s neighbors experiencing shrinking populations. The estimated per capita GDP for 2022 shows a recovery from shrinkage due to the Covid-19 pandemic in 2020 and 2021. Real GDP growth after inflation may end up somewhat lower.
Figure 1: France's Population and Per Capita GDP
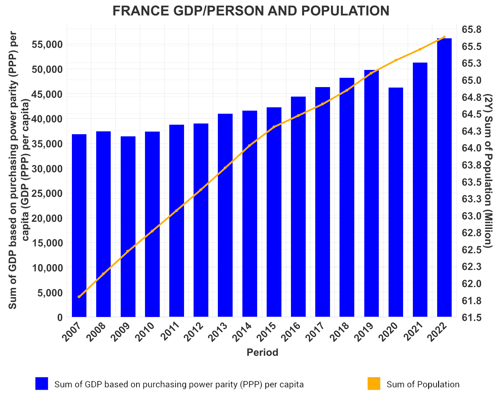
Source: FisherSolve
Tissue demand is also related to consumer pressure from unemployment and inflation, shown in Figure 2. Unemployment has continued to improve since our 2019 report. However, France continues to see about 20% youth unemployment. Inflation, shown as the blue line, took a significant jump in 2022, and the data shown may still be revised higher. This is expected to put a strain on tissue consumers and may result in some switching to cheaper brands as the winter energy bills arrive.
Figure 2: France's Inflation and Unemployment
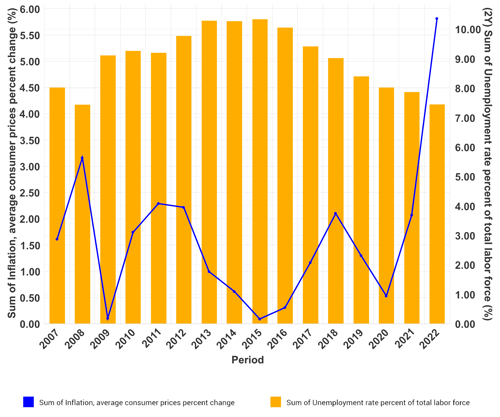
Source: FisherSolve
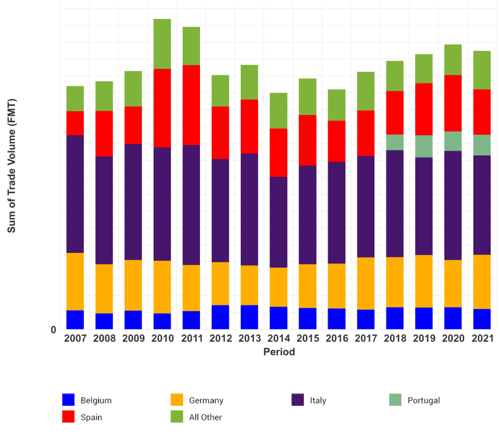
France complements its domestic tissue production with a small and steady flow of imports shown in Figure 3. The main tissue suppliers are France’s adjacent neighboring countries, including Italy, Germany, Spain, and Belgium, with tissue imports from Portugal starting in 2018.
Figure 3: France's Tissue Imports
Source: FisherSolve
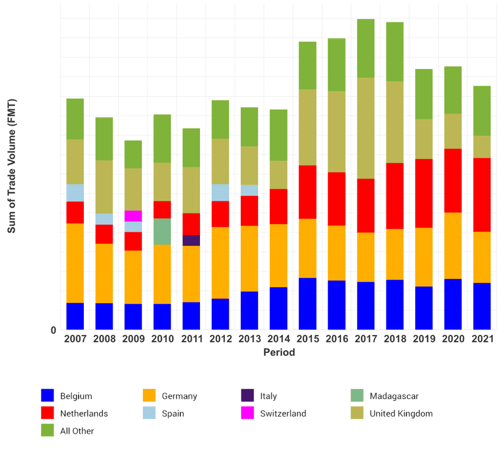
France’s tissue exports include many of the same adjacent neighbors with the addition of the United Kingdom. France tends to import about 25% more tissue than it exports. As a net importer of tissue, domestic tissue production was maintained to be less than domestic tissue demand. This stability of import/export levels may be challenged and realigned as the energy and supply chain cost shocks reverberate through the regional tissue supply systems. France’s tissue exports trend is shown in Figure 4.
Figure 4: France's Tissue Exports
Source: FisherSolve
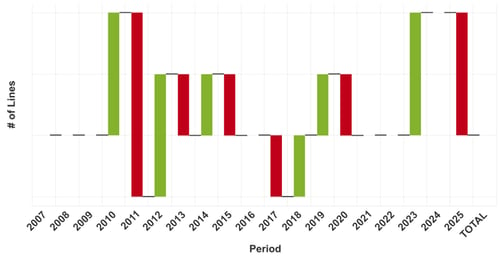
This relatively stable supply has allowed France to maintain a disciplined approach to new machine additions, as shown in Figure 5. The green bars show one to two machine additions spaced out, with the red bars showing tissue machine line deletions. The net result was the net deletion of two machines from 2007 to 2022, with two new machines expected by 2024. Each of the new machines tends to have more capacity, so the total production has increased more than shown in the count change data.
Figure 5: France's Tissue Machine Additions
Source: FisherSolve
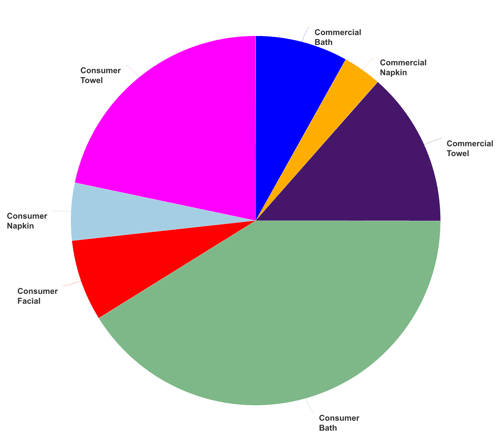
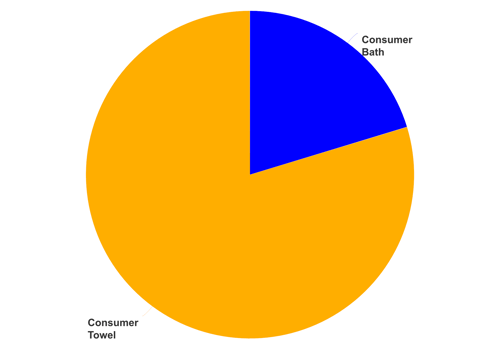
France is a mature tissue market with well-developed consumer and commercial segments and products. The relative proportion of tissue finished products is shown in Figure 6. Consumer bath tissue is the largest segment, but consumer towels are also a well-developed category.
Figure 6: France's Tissue Products
Source: FisherSolve
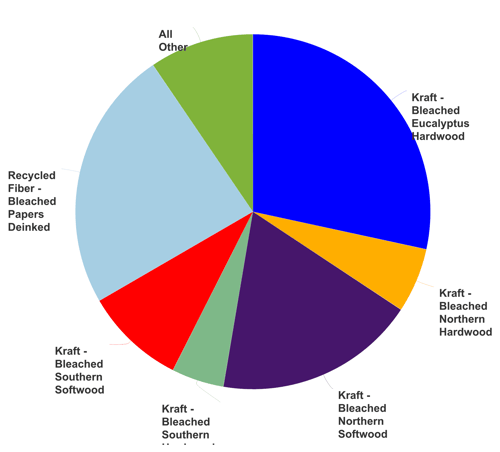
France’s tissue fiber sources are shown in Figure 7. Its recycled fiber tends to go to the commercial tissue segment and the eucalyptus and other northern hardwoods into consumer bath and facial tissue.
Figure 7: France's Tissue Fiber Sources
Source: FisherSolve
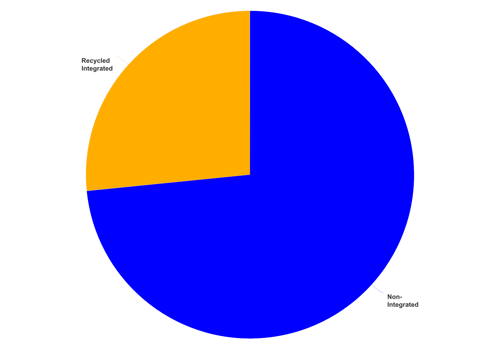
Most French tissue mill sites tend to be based on purchased baled virgin fiber, as seen in Figure 8. This makes France dependent on imported virgin pulp for tissue production and increases the business risk in a high inflation period.
Figure 8: France's Tissue Site Type
Source: FisherSolve
French tissue production includes about 15% advanced tissue production. These tissue machines are TAD and require more natural gas for drying the tissue paper than conventional machines. TAD products do have improved properties and use much less fibre to produce the same tissue product performance. This percentage has been dropping with time as more conventional technology capacity is added. France’s advanced technology is focused mostly on consumer towels where the high absorbency provides more value to the consumer.
Figure 9: France Advanced Tissue Production
Source: FisherSolve
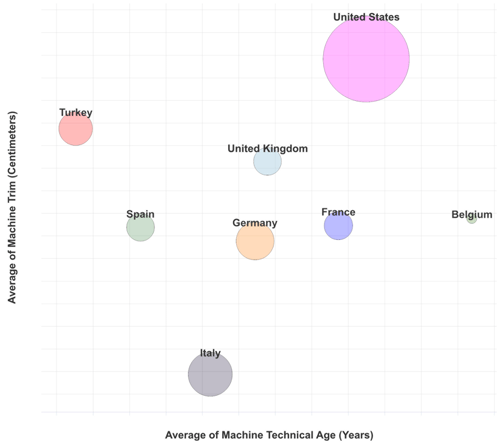
The average relative quality and capability of French tissue machines is shown in Figure 10. A comparison set of France’s closest tissue trading partners was chosen to benchmark capability. Turkey was added as an export-focused comparison with frequent sales to the United Kingdom. The United States is included to provide further energy cost benchmarking in the next section.
Figure 10: France's Trade Group Tissue Machine Quality
Source: FisherSolve
The size of the bubble represents the relative total tissue production in each country and the Y-axis is the average machine size or trim width. Wider machines generally make more tissue per labour unit. The alternative measure is by machine speed. In this case, the X-axis shows the average technical age of each country’s tissue machine fleet. In many cases, this is also related to machine speed. French tissue machines tend to be older and slower than most of the group, which suggests lower productivity and higher costs.
Figure 11: France's Trade Group Cash Cost per Tissue Ton by Country
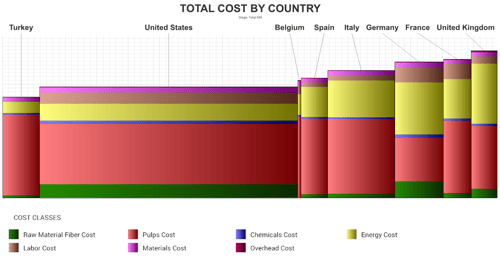
Source: FisherSolve
The machine quality factors discussed so far tend to explain why France’s tissue production has higher average cash costs than most of the comparison set. The stacked bar colours show the other major cost categories that also contribute to these differences. French labour costs and the low proportion of recycled fibre compared to Germany or the United States result in relatively higher costs. In our previous 2019 analysis, France enjoyed an energy cost advantage due to its nuclear power system. We will examine this effect further.
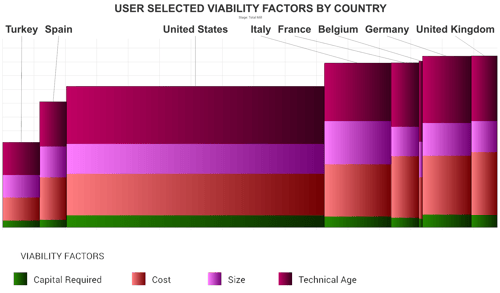
The tissue industry average viability analysis is shown in Figure 12. Italy, France, Belgium, Germany, and the United Kingdom cluster together with higher risk scores, whereas Turkey and Spain are well positioned to weather economic difficulties with their especially low-cost operations.
Figure 12: France's Tissue Industry Average Viability
Source: FisherSolve
Figures 13 and 14 take a deeper dive into cost changes due to the energy crisis in Europe. These charts show the relative cost per ton for tissue mill purchased electric power for each country in the comparison set. Figure 13 is for 4Q2021 and Figure 14 2Q2022. This covers the time of the shut-off of Russian energy to western Europe. France’s electric power cost moved up in relative position, but this understates the magnitude of the cost impact as the cost scales of these charts are quite different. France, Spain, Italy, and the United Kingdom tissue mills saw purchased electricity prices more than double. Germany’s power prices more than tripled, while Belgium and the United States saw very small increases.
Figure 13: France's Relative Cost per Ton for Tissue Mill Purchased Electric Power 4Q2021
.png?width=500&height=240&name=Fig%2013%20Q4%202021%20France%20Energy%20per%20Ton%20-%20Energy%20Curve%20by%20Country%20(1).png)
Source: FisherSolve
The United States is relatively insulated from the power cost acceleration and Belgium appears to have an industrial policy to protect manufacturing. France was expected to be relatively insulated from the power costs due to its nuclear power industry. However, The Wall Street Journal reports that up to 26 of France’s 56 aging nuclear reactors have been offline due to major maintenance issues required to fix stress-corroded piping. Another 18 reactors are down due to labour strikes. These issues could not have come at a worse time and resulted in the loss of both a cost and carbon footprint advantage for France. These issues will be corrected in 2023, but the resilience of the aging nuclear grid will remain a concern.
Figure 14: France's Relative Cost per Ton for Tissue Mill Purchased Electric Power 4Q2022
.png?width=500&height=232&name=Fig%2014%20Q2%20France%20Energy%20per%20Ton%20-%20Energy%20Curve%20by%20Country%20(1).png)
Source: FisherSolve
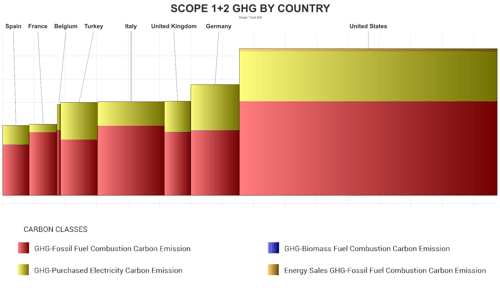
The relative carbon footprint of the study group expressed as scope 1 and 2 emissions for fuel used on site and electric power purchases is shown in Figure 15. Here we see that France retains a good position with some nuclear power in service compared to heavy coal consumption in Turkey and Germany.
Figure 15: Relative Carbon Footprint (Scope 1 and 2) for Fuel Used on Site
Source: FisherSolve
This analysis looks at a snapshot of France and western European tissue-making based on country averages in an extraordinary time of energy price shocks and supply chain disruption. This crisis will pass eventually, but it is not clear when or how the tissue business will adapt. France’s electric power cost and lower carbon footprint advantages seen in 2019 have been significantly offset by maintenance issues in 2022. These will be corrected, but France will have to consider whether it will reinvest in nuclear power to maintain this advantage. Additionally, the country will continue to see higher labor costs as France’s middle-aged tissue fleet means that labor will be a larger percentage cost to broader and faster competition. Finally, the consumer disruptions from a brutal winter of inflation will stress French consumers.
Analysis of competitive position requires specifics on tissue producers and individual machines. This article presents a static picture summary of France’s tissue industry today. Fiber prices, exchange rates, and environmental regulations will change, providing some participants with advantages and others with new challenges. French tissue mills will continue to change hands and perhaps consolidate; neighboring countries may invest in tissue-making capacity, thus affecting France’s imports and exports.