The Spanish tissue manufacturing business was last reviewed in this column a little over two years ago. We noted that Spain had significantly recovered from the 2009 recession by 2019. However, when the population peaked in 2012, the United Nations population division forecasted continued shrinkage due to the low birth rate. Since then, the global Covid-19 pandemic has upset the global economy and supply chains, followed by President Putin’s invasion of Ukraine.
Population growth and the economy are fundamental drivers of tissue consumption in a very mature market – hence the negative impact it has received due to recent events.
Spain’s population growth in 2022 is estimated to be 0.13% by the World Factbook. The current birth rate of 7.13 births per 100,000 population is offset by a death rate of 10.22 deaths per 100,000. However, the population growth comes from a net positive migration rate of 4.35 immigrants per 100,000. This trend in population is shown in Figure 1.
Figure 1: Spain's GDP/Person and Population
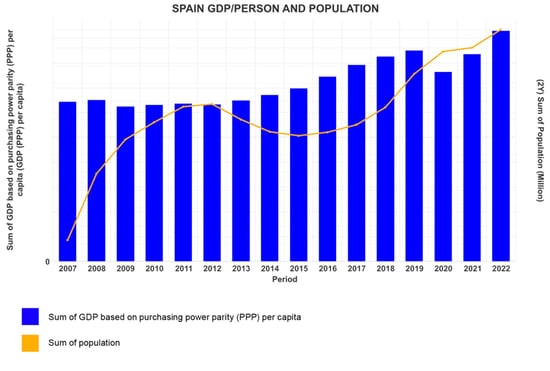
Source: FisherSolve
The country’s population hit a low point in 2015-2016, before resuming growth in 2017. It’s interesting to note that immigration to Spain’s sunny climate appears to have expanded with the pandemic and increased remote working. However, long-range population predictions continue to call for a contraction.
Figure 1 also shows the effect of the pandemic on the country’s economy as a dip in GDP per person occurred in 2020-2021, with growth resuming in 2022. Overall GDP growth was 1.95% in 2019. Together, the factors shown in Figure 1 should result in increased total tissue demand.
Tissue demand is also driven by consumers’ expectations of their economic security. Figure 2 shows the trends of inflation and unemployment on consumer sentiment. Inflation was as low as 0.7% until the global pandemic disrupted supply chains and war upset energy supplies. Unemployment has continued to improve since 2013, dropping from 26% to 13%. Considering the global environment, these numbers do not look like unusual drags on tissue consumption.
Figure 2: Spain's Inflation and Unemployment
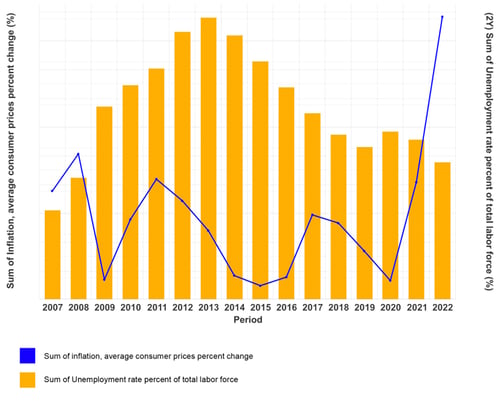
Source: FisherSolve
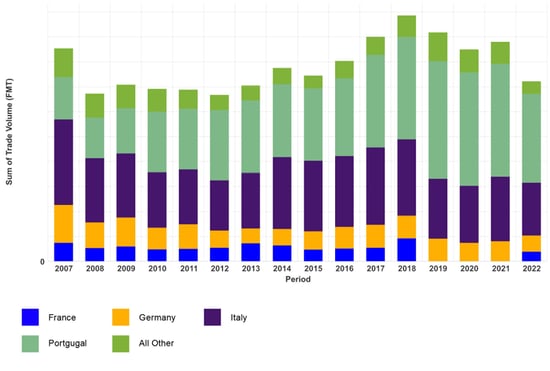
Tissue imports and exports are in rough balance, as shown in Figures 3 and 4. Tissue trade represents less than 20% of Spain’s tissue capacity. Tissue imports are sourced from France, Germany, Italy, and Portugal, as these are Spain’s immediate neighbors and each of these countries possesses advanced process tissue capacity capable of high absorbent capacity towels, unlike Spain.
Figure 3: Spain Tissue Imports Trend
Source: FisherSolve
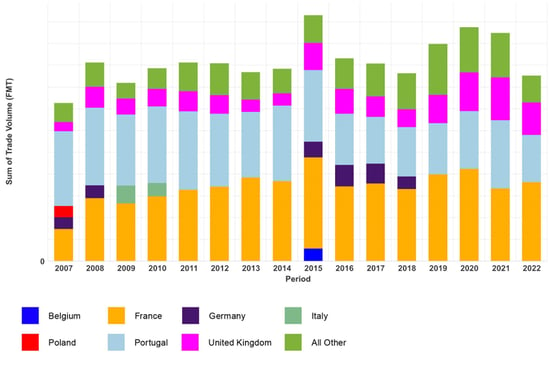
The same tissue import sources are also export customers. Belgium, Poland, and the United Kingdom are also tissue customers, as shown in Figure 4. The long-term balance in tissue trade indicates that Spanish tissue producers are focused on the domestic tissue demand rate for managing capacity.
Figure 4: Spain Tissue Exports Trend
Source: FisherSolve
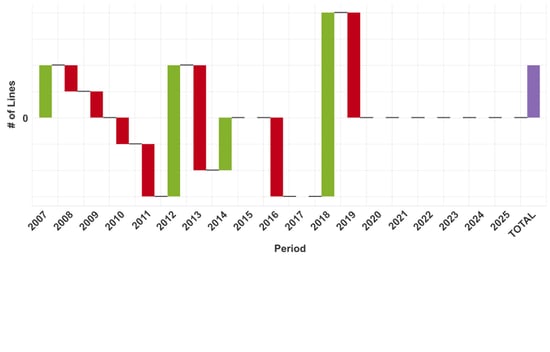
The focus on domestic demand results in a cautious approach to adding new capacity, as shown in Figure 5. This trend plots the number of tissue machines added or removed from Spain’s fleet. New machines in 2007, 2012, 2014, and 2018 are balanced by shutdowns as the new tissue machines come up to speed. The net result is a slow increase in domestic tissue capacity as larger, faster, and newer machines replace older and smaller tissue production lines.
Figure 5: Spain Tissue Machine Count Changes
Source: FisherSolve
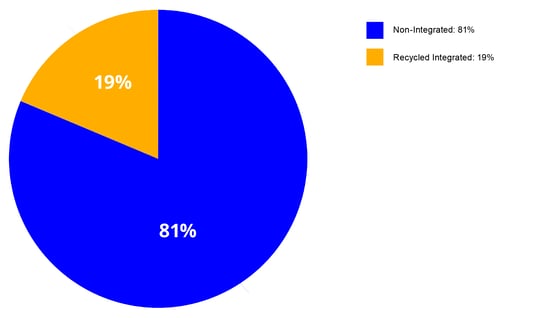
Spanish tissue production sites are chiefly based on baled market pulp as shown in Figure 6. Less than 20% of tissue mills have integrated recycled fiber plants, but not all of these plants supply 100% of the site’s fiber needs.
Figure 6: Spain Tissue Mill Site Type
Source: FisherSolve
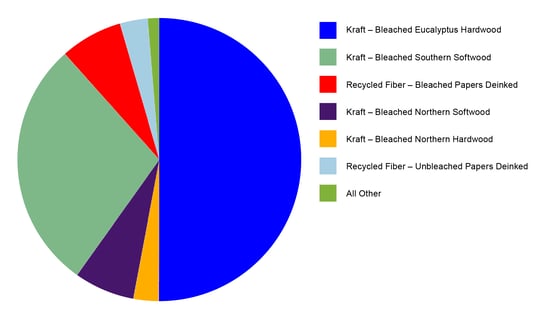
Half of Spain’s tissue fiber source is market eucalyptus pulp, as seen in Figure 7. This is balanced by southern softwood with smaller amounts of northern softwood and hardwood. This furnish provides preferred consumer properties but subjects the producers to the volatility of the global pulp market.
Figure 7: Spain Tissue Fiber Sources
Source: FisherSolve
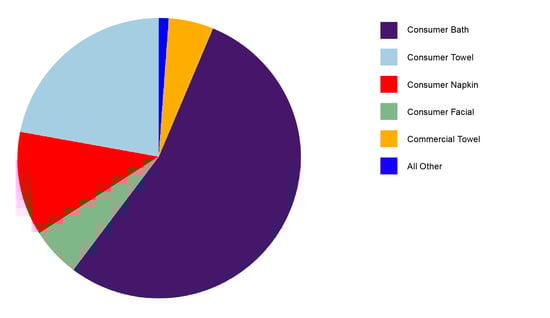
Figure 8 shows the finished tissue products produced. Consumer bath, facial and towel grades represent about four-fifths of the production volume and further explain the market pulp choices.
Figure 8: Spain Tissue Finished Products
Source: FisherSolve
A comparison set of Spanish tissue producers was chosen based on trade data and location. Turkey was added to the group to compare with a country focused on growing tissue exports.
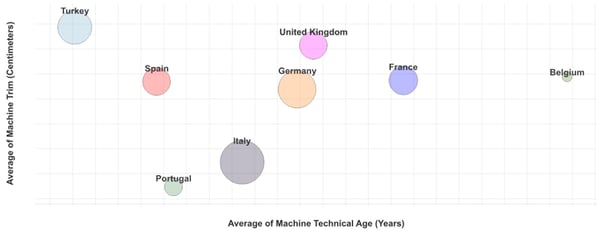
Figure 9 compares the average quality of each country’s tissue machines. The bubbles’ relative size represents each country’s total tissue capacity. The average technical age is shown on the X-axis. Technical age is based on the age of each tissue machine modified by the upgrades and rebuilds of the tissue line equipment to improve productivity and product quality. The Y-axis shows the width of the paper machine trim. Trim width is a significant factor in each machine’s ultimate production rate capability. Narrower machines tend to use the same size crew as a wider machine, but narrow machines have more significant edge effects for energy and sheet wastes. Machine speed is an alternative indicator to sheet width but is easier to improve after the machine is constructed. Turkey has the newest and widest tissue fleet followed by Spain, Portugal, and Italy. On average, Spanish machines are in a good position except for the lack of advanced tissue technology seen in neighboring countries.
Figure 9: Spain Tissue Machine Quality
Source: FisherSolve
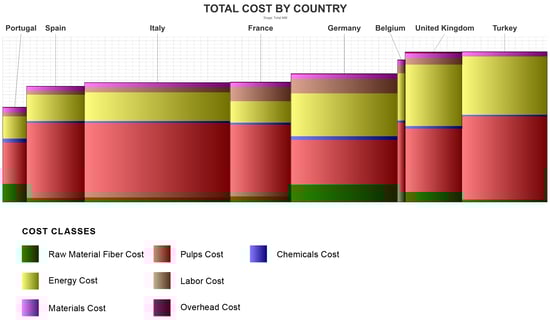
The same comparison set is used in Figure 10 to benchmark the average production cash cost for each country. The width of each country’s bar represents the relative size of production. Spain is in a good cost position with only Portugal having lower costs. It’s important to note however that Portugal has a much larger amount of integrated fiber and lower market pulp costs than Spain. This explains a lot of the cost differences seen in the Iberian Peninsula. Italy and France are very similar to Spain. Germany has higher energy costs but tends to use more low-cost recycled fiber. Higher energy costs in the United Kingdom and Turkey push these countries to a high-cost position on average.
Figure 10: Benchmark Costs Curve by Country
Source: FisherSolve
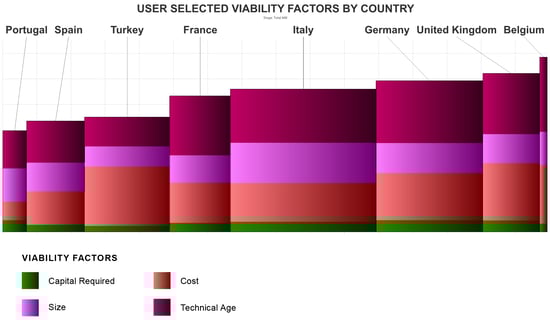
Production costs only provide a snapshot of the industry viability over time and can be misleading in times of economic disruption. Figure 11 provides a view of the next five years using Fisher’s Viability Index, which was used to combine cost position and asset age with additional competitive factors. Portugal and Spain also lead the comparison set in this metric as well. However, Turkey moved to a number three position, partly due to its new machines.
Figure 11: Spain Comparison Set Viability
Source: FisherSolve
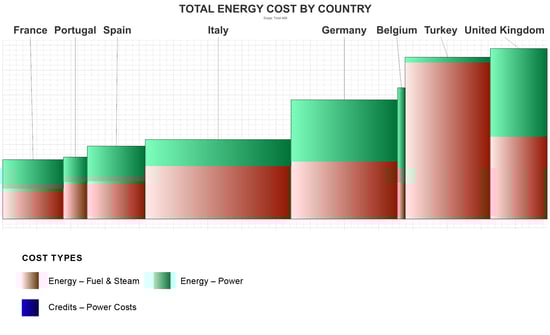
Figures 12 and 13 take a deeper dive into the energy effects on a country’s competitive position. Figure 12 is the cost of energy per ton of tissue production for each country. The bars are colored to indicate on-site production energy from fuels and electricity purchases. France, Portugal, and Spain are currently in a low-cost energy position. However, it’s important to keep in mind that this is a snapshot of the current energy supply disruption, and it may need to be revisited in a few years.
Figure 12: Spain Comparison Set Energy Cost per Ton Euro/FMT
Source: FisherSolve
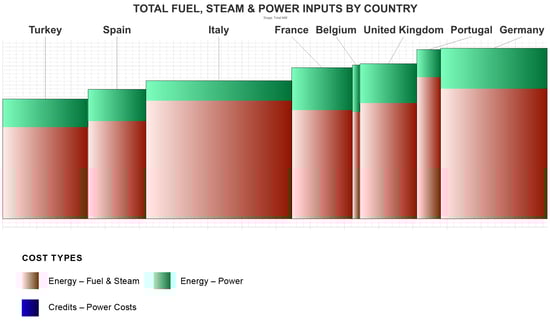
Figure 13 shows the same energy consumption rate, but energy units, or GJ, are substituted for the cost to get a comparison independent of current energy pricing in each country. Spain retains its favorable position, but Turkey moves from last to first in energy consumption. Some differences reflect the efficiencies of the sites, but others can be explained by the grades produced and the technology used.
Figure 13: Spain Comparison Set Energy GJ per Ton
Source: FisherSolve
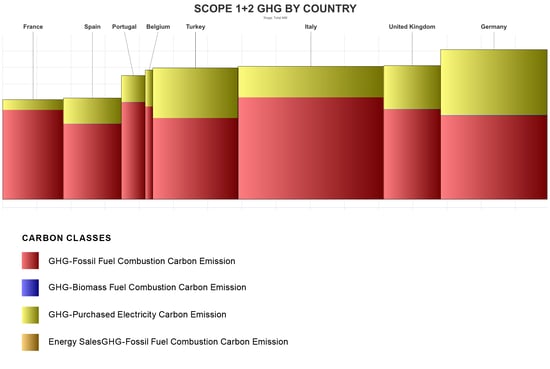
Figure 14 shows the average scope 1 and 2 carbon emissions per ton of production, representing the same energy consumption in Figures 12 and 13. France leads with the lowest carbon emissions due to the nuclear electric grid, but Spain comes in at second place. Turkey and Germany have significant coal energy inputs that drive emissions higher and places them as some of the larger emitters of this comparison set.
Image 14: Spain Comparison Set Scope 1 and 2 Carbon Emissions
Source: FisherSolve
This analysis looks at a snapshot of Spain and western European tissue-making based on country averages in an extraordinary time of energy price shocks and supply chain disruption. This crisis will pass eventually, but it is unclear when or how the tissue business across Europe will adapt.
Spain’s domestic tissue production capacity continues to be in good shape. Imports and exports remain in balance and capacity additions continue to be measured to replace older and higher-cost tissue machines without oversupplying the market. The country depends on market pulp imports but has maintained a good cost position relative to its peers. Also, its carbon emissions are lower compared to the rest of the competitive set, except for France.
Population growth has resumed, but the long-term population is still expected to contract slowly. Consumer purchasing power has grown recently. The impact of out-of-office work opportunities and Spain’s preferred climate may result in further immigration gains, but this is unlikely to offset the low birth rates completely.
Analysis of competitive position requires specifics on tissue producers and individual machines. This article presents a static picture summary of Spain’s tissue industry today. Fiber prices, exchange rates, and environmental regulations will change, providing some participants with advantages and others with new challenges.
Spanish tissue mills will continue to change hands and perhaps consolidate; neighboring countries may invest in tissue-making capacity, thus affecting the country’s imports and exports.