Italy plays two different yet highly significant roles in the global tissue business. The first is as a producer for domestic and export tissue production, the role in which we will explore in this report, and the other as an innovator, designer, and manufacturer of tissue production equipment. Italian engineering and design skills are sought out globally for tissue machines and converting equipment supplies — however, this report does not cover that equipment business.
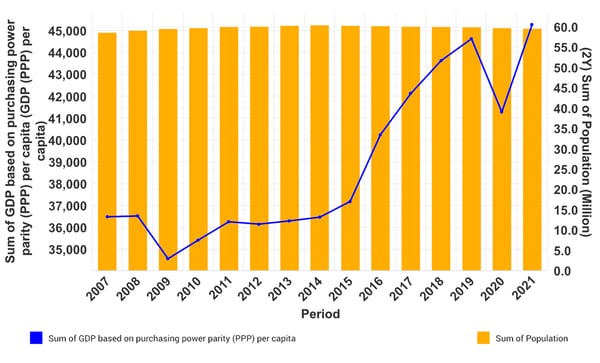
Domestic demand for tissue products depends on economic and cultural factors. Italy’s gross domestic product and population trends are shown in Figure 1. GDP is expressed as purchasing power parity per capita and illustrated as the blue line on the chart. Per capita GDP has vastly increased over the last 14 years and is expected to continue to support consumer purchases for tissue products. The population is shown on the chart as the bars representing millions of people. Italy has had a relatively flat to decreasing population over the trend shown in Figure 1. An alternative data point from the world factbook suggests that Italy had an estimated 0.09% population growth in 2021. The ratio of births to deaths is less than one, meaning that any population growth is dependent on migration.
Figure 1
 Source: FisherSolve Next
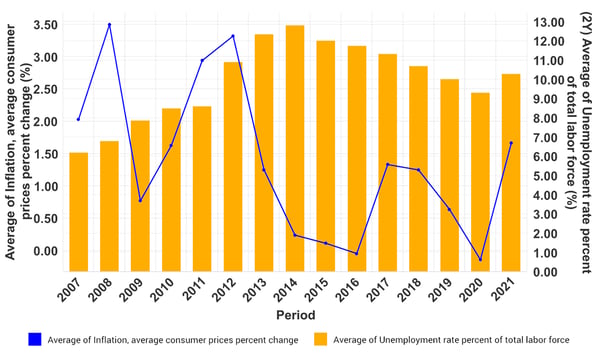
Inflation and unemployment are two economic factors that limit domestic growth in tissue demand. Figure 2 shows the inflation trend moderating from two high peaks to a lower range. However, inflation appears to be increasing again due to the global supply chain crunch. The unemployment rate is represented in Figure 2 as the bars and shows a build-up to peak unemployment in 2014 before gradually decreasing until its next increase in 2021. The unemployment rate is relatively high yet consistent with similar countries in Europe. Overall, the economic conditions are positive to support continued growth in tissue demand per person and any change that would occur in the market due to population would be minimal and insignificant.
Figure 2
 Source: FisherSolve Next
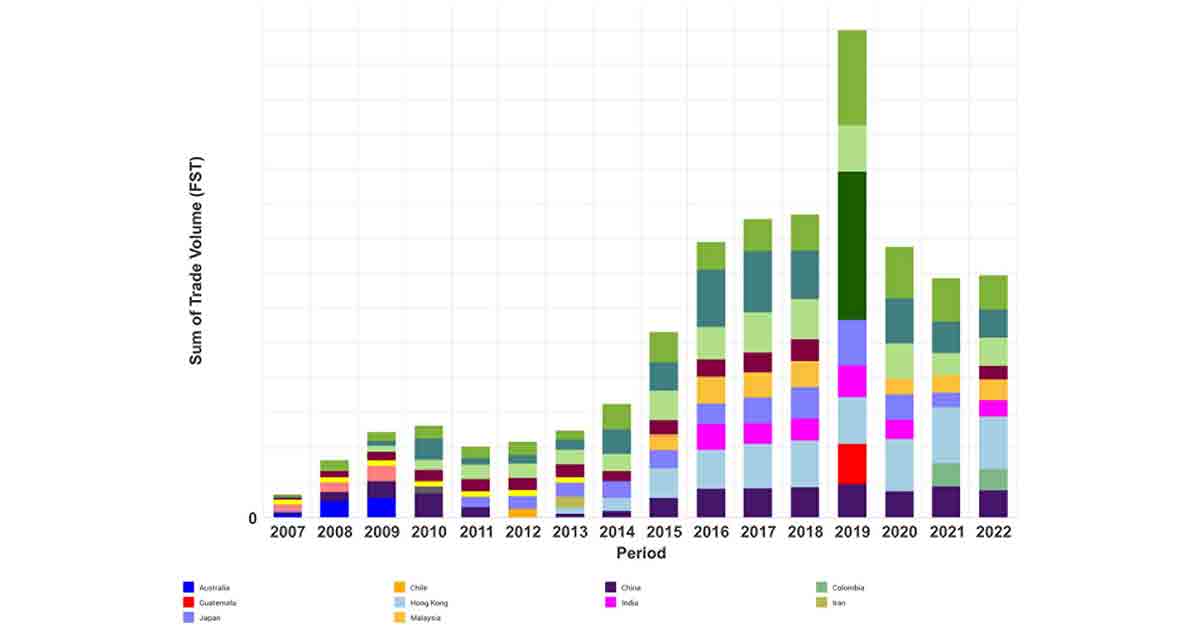
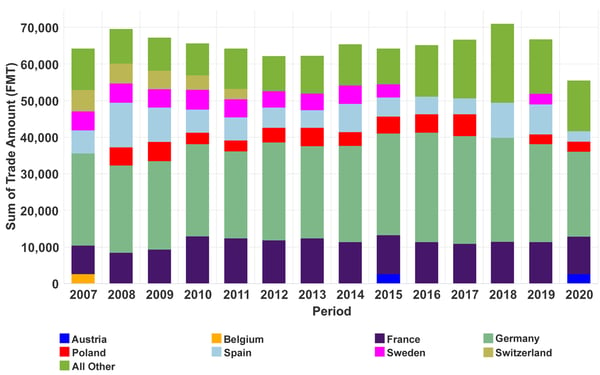
Italy's domestic tissue demand is partially met by imports, as shown in Figure 3. The major suppliers of Italy's tissue imports are France, Germany, Poland, Spain, Sweden, and Switzerland. The "all other" category sitting at the top of the bars is 30% of the total in 2021. These globally sourced imports represent 4% or less from any one country not named in the chart.
Figure 3
 Source: FisherSolve Next
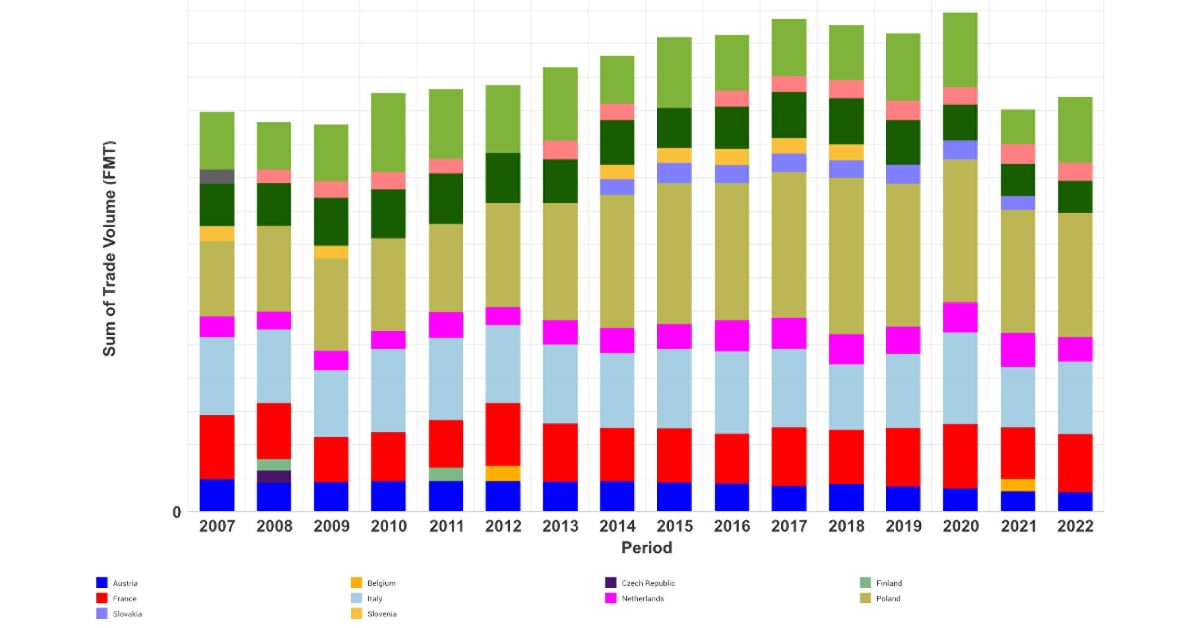
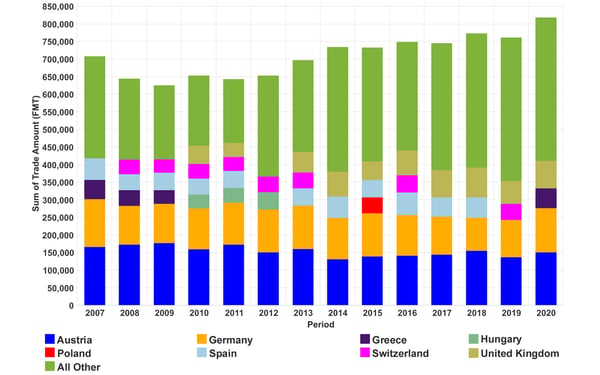
Italy’s tissue exports are shown in Figure 4, which are trending upward approximately ten times compared to the volume of Italian imports. This shows that Italy is a substantial tissue producer for exports. Italy’s main tissue customers include France, Germany, Greece, Hungary, Poland, Spain, Switzerland, and the United Kingdom. Many of these are the same countries that also supply tissue to Italy. The overall trend of exports has been growing through the periods shown, and the “all other” category has been increasing as the aforementioned countries’ business is shrinking. This now represents 50% of Italy’s export business, but individual countries comprise less than 4% of the total. Italy’s tissue business has started to become more export-driven with a more diverse customer base.
Figure 4
 Source: FisherSolve Next
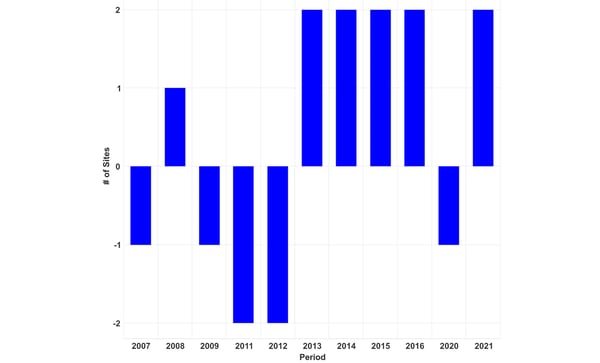
Italian tissue producers have also been building capacity outside of Italy during this period. They have operated in neighboring countries for some time but have recently expanded their focus, such as Sofidel’s expansion into the United States. It’s important to note that this report shows only Italian domestic production statistics. Italian tissue manufacturers have embarked on a careful expansion and replacement strategy to grow and modernize their tissue production. Figure 5 shows the new tissue machine additions and old tissue machine deletions throughout the study period. It is reasonable to assume that most new machines have significantly more capacity and quality capability than the machines being scrapped.
Figure 5
 Source: FisherSolve Next
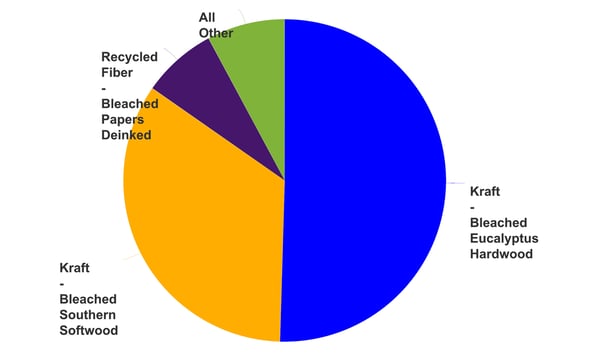
Italy relies mainly on virgin market pulp for tissue production. The data in Figure 6 illustrates that 50% of the total Italian tissue furnish is made from eucalyptus pulp, while bleached southern softwood comprises 34% of the furnish. Recycled fiber consists of only 7% of the entire mixture. The “all other fibers” include some bleached and unbleached CTMP and other minor components for a total of 8% of the mix. Italian tissue production consists of predominantly premium fibers, which supports export development with premium products.
Figure 6
 Source: FisherSolve Next
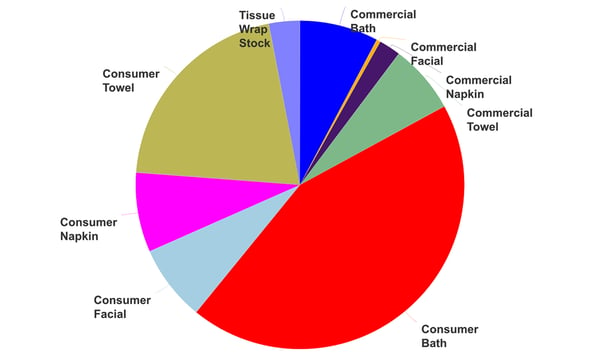
The Italian tissue finished product mix is shown in Figure 7. Consumer bath tissue makes up almost 44% of the total production while consumer towel represents nearly 21% of the total. Coupled with the Italian flair for the finished product emboss and design, this supports further development of the tissue export business.
Figure 7
 Source: FisherSolve Next
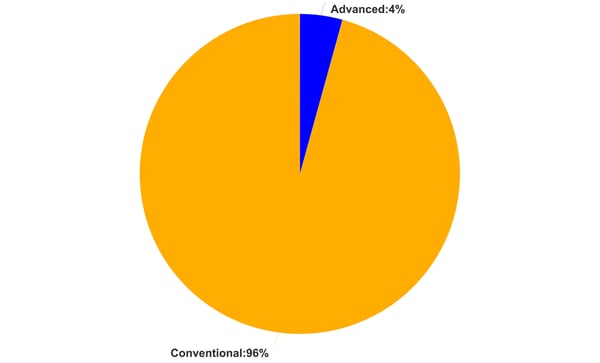
Italy has started adding advanced tissue process assets to the Italian tissue machine fleet. Figure 8 shows that advanced tissue manufacturing makes up only 4% of production. Advanced tissue processes are considered through air drying or one of the other textured or structured processes.
Figure 8
 Source: FisherSolve Next
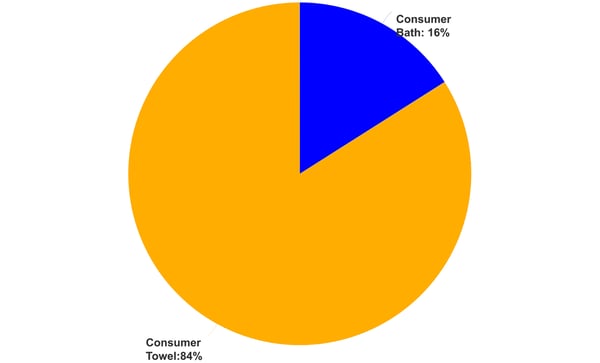
This small amount of advanced technology is well applied, as shown in Figure 9. 84% of the advanced technology capacity is devoted to consumer towels. Using this process, the improved thickness and absorbency of consumer kitchen or household towels provide more extensive consumer benefits with lower fiber intensity. Consumer bath advanced tissue benefits are positive but lower than towels (except in North America where very high bath softness is appreciated). Italian consumer bath represents only 16% of the total advanced technology production.
Figure 9
 Source: FisherSolve Next
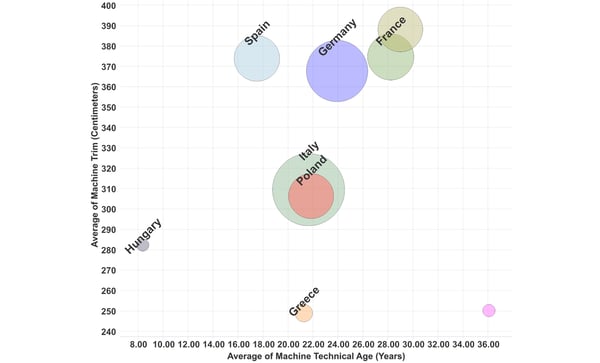
Figure 10 provides a perspective on Italy’s average tissue machine quality versus its essential export partners. Italy occupies the center of the chart with its giant bubble. The size of the bubble represents total capacity by country, the X-axis represents the average technical age of each countries’ tissue machine fleet (technical age in years means the relative competitiveness based on when it was built and how recently it’s been updated), and the Y-axis represents the average machine trim in centimeters. More comprehensive machines tend to be more efficient in energy and labor costs. Smaller markets like Hungary, Switzerland, and Greece tend to use narrower devices to add smaller portions. If Italy continues its active machine-building and replacement, it should evolve into a more competitive position.
Figure 10
 Source: FisherSolve Next
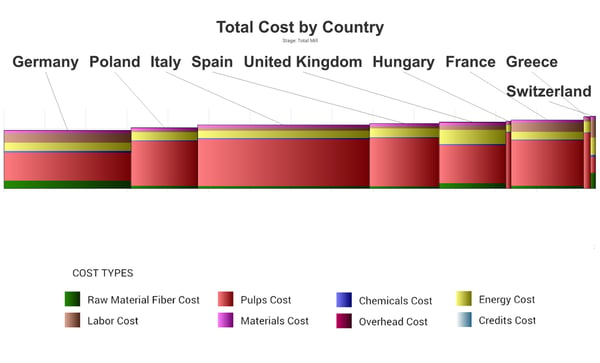
The competitive cost curve for these trade partners is shown in Figure 11. Italy is in the center of the chart, with the broadest bar representing its larger capacity. The Italian all premium version fiber mix means an increased cost over a country like Germany that uses more cost-effective recycled fibers. Energy cost is shown as the yellow bar and is relatively lower for Italy compared to the United Kingdom.
Figure 11
 Source: FisherSolve Next
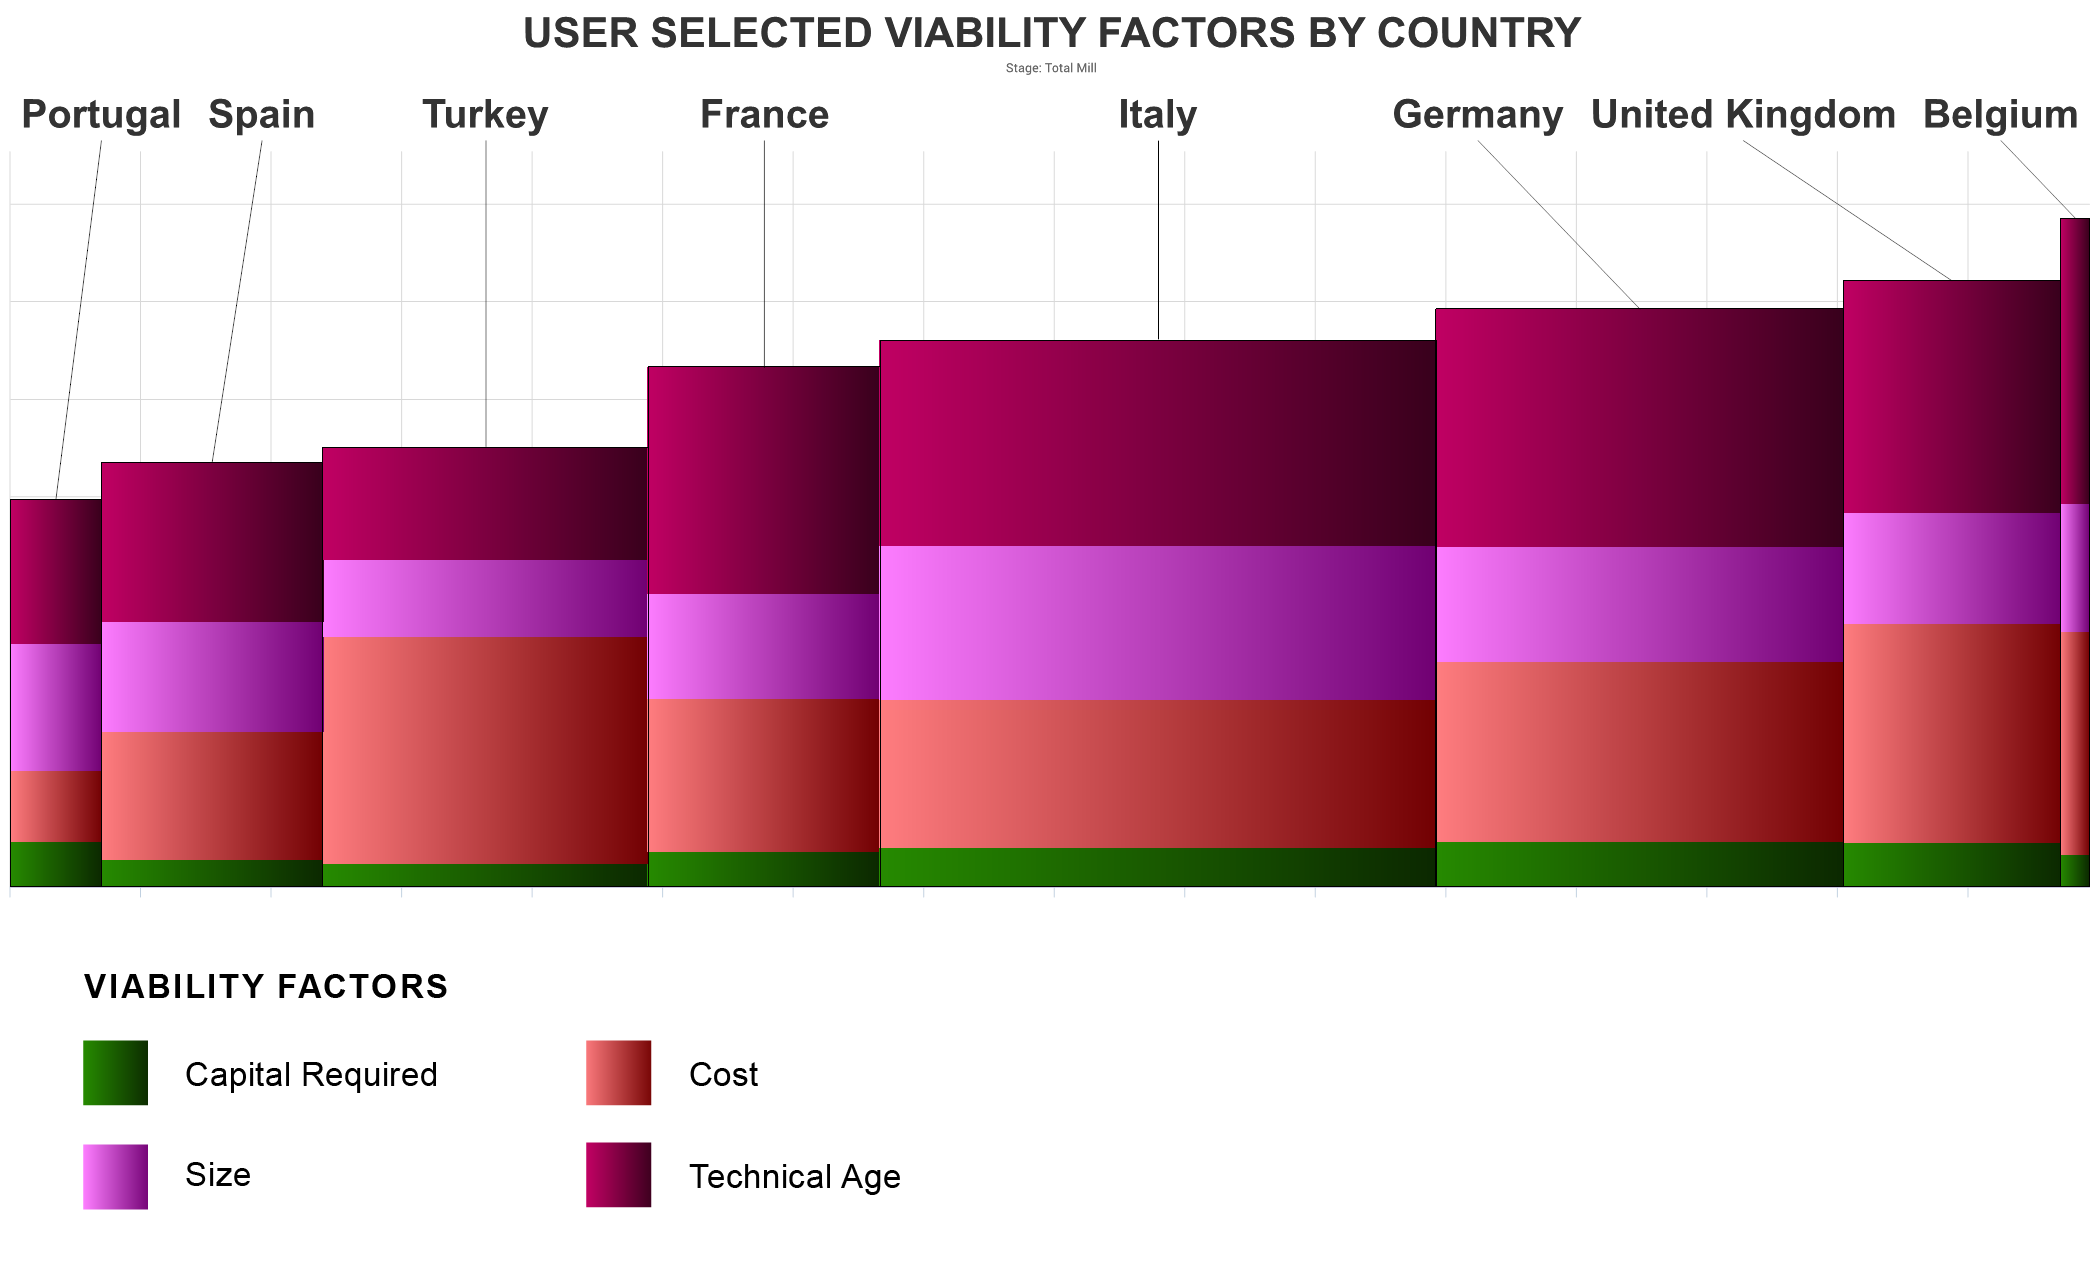
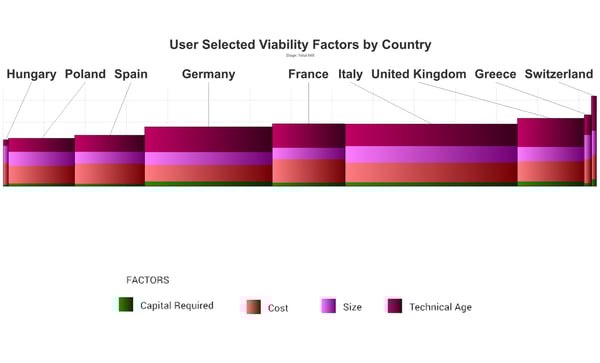
The cost curve analysis is complemented by manufacturing viability shown in Figure 12. Tissue manufacturing viability is a FisherSolve Next index that includes costs, the technological machine age, mill site, and corporate strengths to provide a look into the relative future viability or resilience of a region, country, mill, or individual tissue machine. Italy's tissue machines possess an average viability, but are significantly better than the United Kingdom, Greece, and Switzerland.
Figure 12
 Source: FisherSolve Next
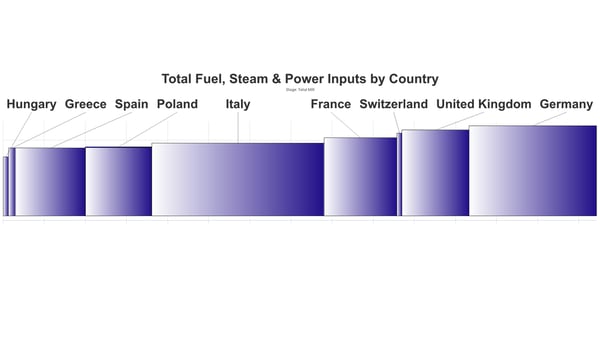
Figure 13 shows the fuel, steam, and power inputs for the same countries' tissue fleets. FisherSolve Next can plot this as either total energy cost per tonne or total energy units per tonne. In this case, the total energy units are KJ per tonne shown. Total energy consumption per tonne is one component of carbon emissions and offers the relative efficiency of production for a generic team of energy. Carbon emissions also include the relative carbon content of a given energy source. Italy is relatively efficient compared to the United Kingdom and Germany on this measure.
Figure 13
 Source: FisherSolve Next
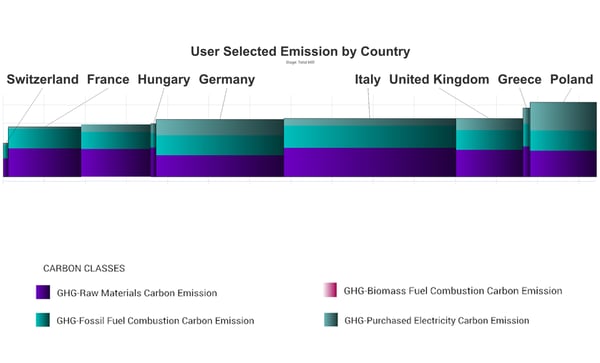
The carbon emissions per tonne of tissue products are shown in Figure 14. This includes the relative energy efficiency shown in Figure 13. Italy’s position is average in this group.
Figure 14
 Source: FisherSolve Next
Italy will grow its tissue business with exports to make up for the stagnant domestic demand. Their tissue trade has traditionally been with neighboring countries, but now 50% of the tissue exports are going to new markets. Further expansion of advanced tissue technology will depend on domestic product reception and the performance needed for export markets. Continued export growth could reset the competitive scene for Italy in serval years. The increase in export volume should allow Italy to update and add tissue capacity and also provide good support for Italy’s tissue equipment business.
Analysis of competitive position requires specifics on tissue producers and individual machines. This article presents a static summary of Italy’s tissue industry today. Fiber prices, exchange rates, and environmental regulations will change, providing some participants with advantages and new challenges. Italy’s tissue mills will continue to change hands and consolidate.