In the export-driven powerhouse, the tissue sector is a rare exception - a net importer. But with unemployment and inflation impacting less than in most developed economies, there is little obstruction to consumption growth. Therefore, producers are concentrating on technical capability opposed to expansion.
South Korea is an export-driven industrial powerhouse with one of the most developed economies in Asia. Its pulp and paper market is expected to grow at a CAGR of 5.20% between 2023 and 2028. A major critical factor in this market growth is the growing consumer awareness regarding eco-friendly products and packaging.
In 2020, around 11.63 million tons of paper were produced in South Korea. As an export-driven economy, South Korea was most definitely affected by Covid-19 closures and the Ukraine war.
Figure 1 shows the trend of GDP per person adjusted for purchasing power parity as the blue bars and population as the yellow line. The economy contracted slightly in 2020 (-0.71%) but resumed a 4.15% growth in 2021. The population trend shows a slight dip during the Covid-19 pandemic, possibly due to migrant workers returning home. At 51,966,948 population estimated in 2023, the growth rate is expected to slow to 0.23% in 2023. The aging population will begin to look like other highly developed countries, with deaths exceeding births in 2023.
Figure 1: South Korea GDP/Person and Population Trend
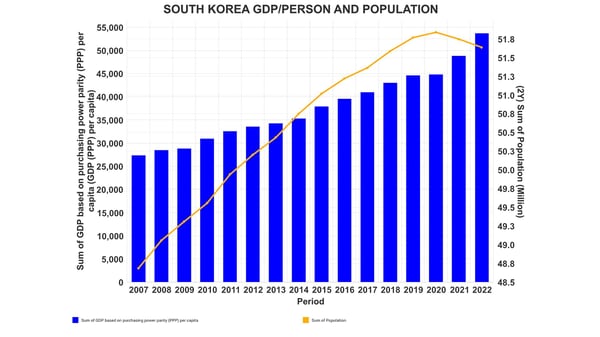
Source: FisherSolve
Nevertheless, the observed population growth continues due to net positive migration. The slowing growth or static population is a drag on further tissue consumption growth, but the positive GDP growth will continue to support additional tissue consumption per person.
Inflation and unemployment are negative factors in consumer or commercial tissue consumption expansion. Figure 2 illustrates these trends with inflation represented as the blue line and unemployment as the yellow bars.
Figure 2: South Korea's Inflation and Unemployment
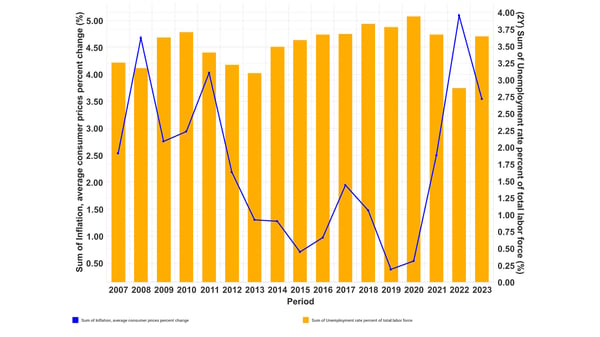
Source: FisherSolve
Like many developed economies, South Korean inflation dropped until the Covid-19 pandemic, and then jumped back up with the global disruptions. However, unemployment and inflation appear to be less impacted compared to most developed economies, resulting in little obstruction for tissue consumption growth. South Korea's economy is primarily based on exporting industrial goods.
However, tissue imports tend to exceed exports by more than two to one. Figure 3 shows tissue import trends and critical suppliers. As we can see, Indonesia has grown to be South Korea's largest tissue supplier. Indonesian tissue exports to South Korea reportedly spiked during the pandemic-induced mill closures. The 2022 tissue import rate continues at a rate that could stress the demand for domestically produced tissue.
Figure 3: South Korea Tissue Imports
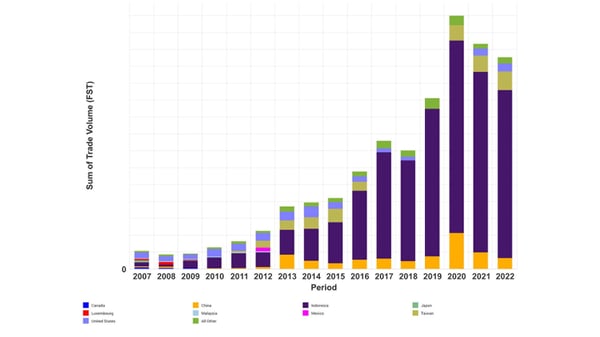
Source: FisherSolve
South Korea's tissue export trend is shown in Figure 4. As illustrated, it appears that their export customer base is more diverse than their import suppliers (Indonesia).
Figure 4: South Korea Tissue Exports
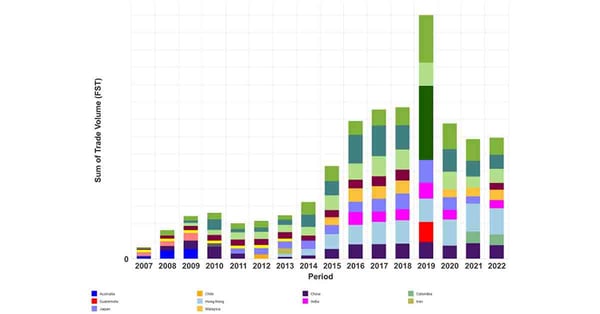
Source: FisherSolve
South Korea continues to be a net importer of tissue. The net import rate in 2022 suggests that it would take two more modern tissue machines in South Korea to balance trade. With growing tissue imports, South Korea's producers tend to be conservative in adding new capacity.
Figure 5 shows the trend in the number of tissue machines operating. The net result is slight production growth as new machines installed in the past 5-10 years are more productive than the tissue machines replaced. More slow capacity is expected from process debottlenecking on the existing machines.
Figure 5: South Korea Tissue Machine Count Changes
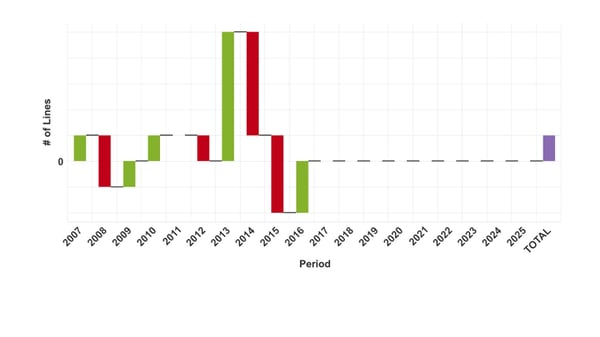
Source: FisherSolve
Recovered fiber from recycled waste is the primary source of tissue fiber for South Korea. Every tissue mill site is partially or fully integrated with on-site fiber recovery and deinking. This potentially reduces production costs and relative risk. Figure 6 shows that smaller amounts of eucalyptus and southern softwood pulp are imported.
Figure 6: South Korea Tissue Fiber Sources
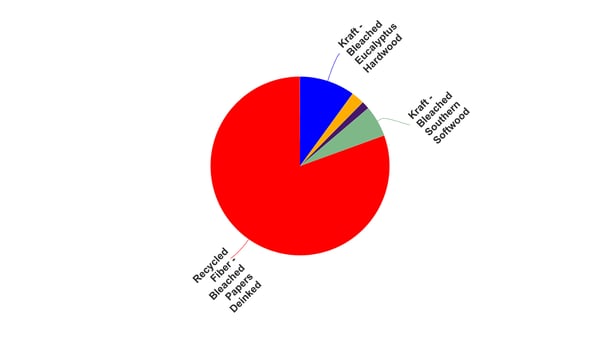 Source: FisherSolve
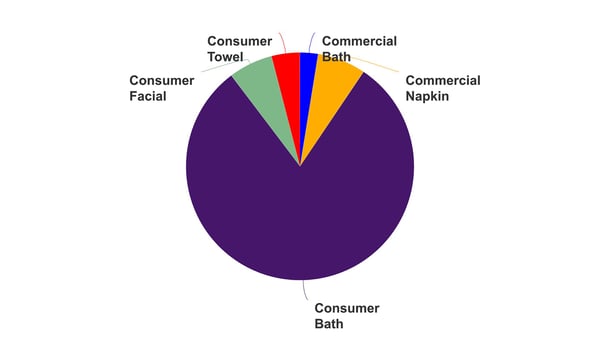
Consumer bath tissue comprises most of South Korea’s tissue production, as seen in Figure 7. Production of commercial napkins and bath tissue are almost equal to consumer facial and consumer towels.
Figure 7: South Korea Finished Tissue Products
 Source: FisherSolve
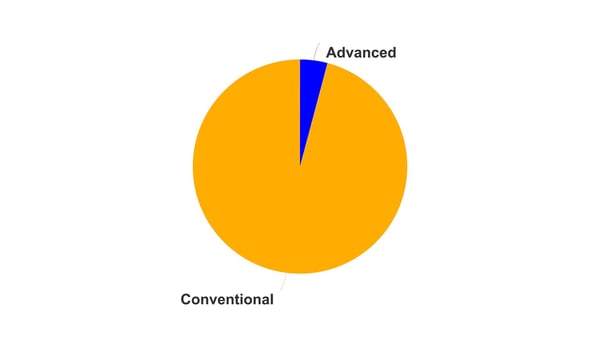
This suggests that away-from-home handwashing does not typically include drying hands with paper towels. Cloth roll towels and electric hand dryers must be the norm. South Korea does have some advanced tissue process capability, but it represents a tiny fraction of the total tissue production.
Figure 8 provides a sense of this proportion. After checking the tissue import and export trends again in Figures 3 and 4, a tissue producer comparison set of nine countries was chosen. These include nearby China, Japan, Indonesia, Malaysia, and Taiwan, Republic of China. Australia and North America were also selected for the comparison set.
Figure 8: South Korea Advanced Tissue Process
 Source: FisherSolve
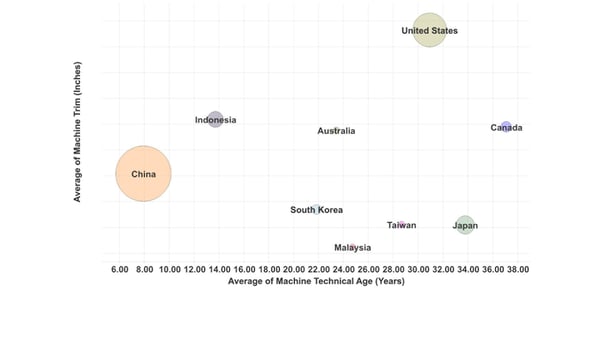
Figure 9 plots each country's tissue production as the relative size of the bubble. The average tissue machine technical age is plotted on the X-axis and against the average trim size as an indicator of the health of each country's tissue machine fleet.
Figure 9: South Korea Tissue Machine Quality
 Source: FisherSolve
China is the largest producer using the newest and presumably up-to-date tissue machines. Indonesia's production is much smaller, but it is also using up-to-date machines that are somewhat wider. South Korean tissue machines are middle-aged, like Australia or Malaysia. Japan, Canada, and the United States have the oldest machines. Note the difference in average size for tissue machines in the United States.
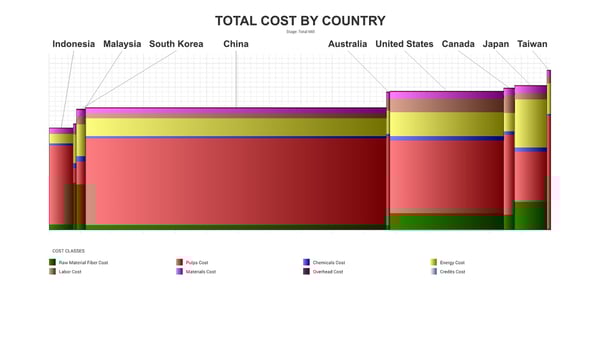
The estimated average cash costs per ton for tissue production for each country in the South Korean comparison set is plotted in Figure 10. The width of each country's bar represents the total production by country. The relative height of each bar represents the average cash cost of tissue production.
Figure 10: South Korea Tissue Production Cash Cost
 Source: FisherSolve
South Korea has the third-lowest costs after Indonesia and Malaysia. It is also comparable with China's overall cost – although the cost components are quite different. Korea's raw material fiber cost bar for recovered fiber reduces the need for expensive baled pulp seen in China's costs. China is very restrictive in the use of recovered fiber for tissue production.
Labour costs in Australia, Canada, and the United States are much higher per ton. South Korean tissue production could potentially be threatened from low-cost producer Indonesia.
The FisherSolve viability analysis of the same set is shown in Figure 11. The bar width shows the relative production for each country, while the bar height shows the relative viability risk over the next five years.
Figure 11: South Korea Tissue Machine Viability
.jpg?width=600&height=338&name=Fig%2011%20South%20Korea%20Tissue%20Viability%20-%20Rank%20Curve%20by%20Country%20(1).jpg) Source: FisherSolve
Source: FisherSolve
This viability risk rating takes average cash costs and adds other factors such as the future capital required and technological age. Again, South Korea shifts from medium cost to high viability risk along with Japan and Taiwan, Republic of China. Indonesia again has the preferred low-risk spot, followed by China and the United States.
Figure 12 is the final chart showing each country's Scope 1 & 2 carbon dioxide emissions per ton. Again, the width of each bar represents the total production by country, and each bar's height is the average emission per ton of tissue produced.
Figure 12: South Korea Tissue Machine Carbon Emissions
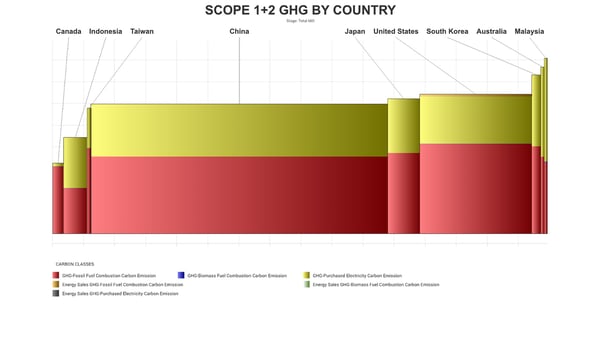
Source: FisherSolve
Scope 1 & 2 carbon emissions in tissue mainly come from the grid electricity and fuel burned onsite for power and steam. Canada leads here with very low-carbon electricity, primarily due to hydropower dams. Indonesia is also a lower carbon emitter per ton. China, Japan, and the United States are all very similar as they sit in the middle of the pack. South Korea, Australia, and Malaysia have relatively high carbon emissions per ton.
South Korea's tissue business is not an export dynamo like its other industrial sectors. South Korea is a net tissue importer with growing volumes from low-cost Indonesia. The population is expected to become greyer and grow slowly – if at all.
After a building spree five to ten years ago, tissue producers now appear to concentrate on maintaining technical capability opposed to expansion. South Korea's integrated and lower cost recovered fiber provides some competitive advantage.
This analysis comes as the world is experiencing high inflation and disruption of energy supplies following the pandemic and the Ukraine war. The viability and carbon analysis provides a way to look beyond immediate costs for competitive advantages. The viability risk of South Korea's tissue production is relatively high, along with its carbon emissions too.
This analysis is based on averages of cost and production, but it assumes that every ton of tissue is fungible and equally valued by customers. We know that this is not reality, as tissue quality or performance expectations vary widely between the countries in the comparison set selected.
For example, consumers' expectations in Australia, Canada, Japan, South Korea, and the United States are somewhat higher than in China and Indonesia. Therefore, comparing costs or production rates of substitution products can be disingenuous.
Analysis of competitive position requires specifics on tissue producers and individual machines. This article presents a static picture summary of South Korea's tissue industry today. Fiber prices, exchange rates, and environmental regulations will change, providing some participants with advantages and others with new challenges. South Korean tissue mills will continue to change hands and perhaps consolidate; neighboring countries may invest in tissue-making capacity, thus affecting South Korean imports and exports.