*Fisher International’s data does not yet attempt any assessment of the potential impact of the war in Ukraine on supply chains and energy costs across the region which includes Poland and Romania. It does, however, include objective speculation on the shorter-term prospects for tissue in those two countries*
Poland has a rich history detailing all the way back to the 10th century until it was partitioned by Russia, Austria, and Prussia in 1795. However, Poland regained independence after WWI in 1918, but then suffered greatly at the beginning of WWII with the invasion and occupation by Germany and initially the Soviet Union. Post-war, Poland was controlled by the Soviet Union until the “Solidarity Labor Movement” began to shake them loose from Soviet control.
Poland’s transformation into an economic leader began with free elections in 1989, and now Poland is the sixth largest economy in the European Union (it joined in 2004) with a robust tissue business, including tissue mills and tissue equipment fabrication. However, Poland's economy faces several challenges, including transportation infrastructure and a rigid labor code, which has resulted in more younger Poles immigrating to other EU member states.
Lands in Romania, on the other hand, were held by the Turkish Ottoman Empire until 1859, which then united as Romania in 1862, and gained recognition of independence at the end of WWI. However, the Soviet Union occupied Romania after initially aligning with Germany, and The Soviet’s domination under a local dictator continued for decades until the dictator was overthrown in 1989, and a non-communist government was established in 1996.
Romania joined NATO in 2004 and the EU in 2007. Economic growth rebounded from 2013 to 2017, driven by strong industrial exports and agricultural harvests, but was hampered by an aging population and immigration of skilled labor to other EU countries.
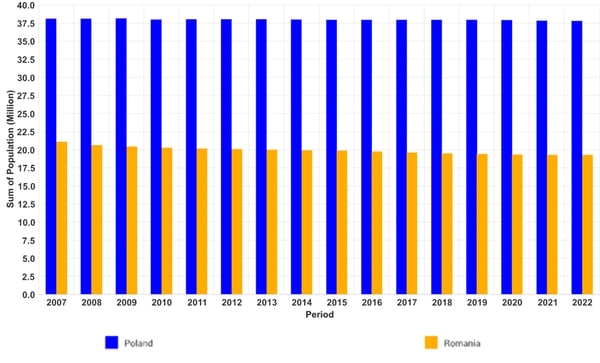
Poland's recent population trend is shown in the blue bars in Figure 1 (note that we will continue to use the blue color to represent Poland and the yellow bars to represent Romania). Poland's overall population is trending down at -0.26% in 2022 for a current estimated total of 38,093,101. Romania's recent population, represented as the yellow bars in Figure 1, is trending down at -1.09% in 2022 for a current estimated total of 18,519,899.
Figure 1: Poland and Romania Population Trend
 Source: FisherSolve
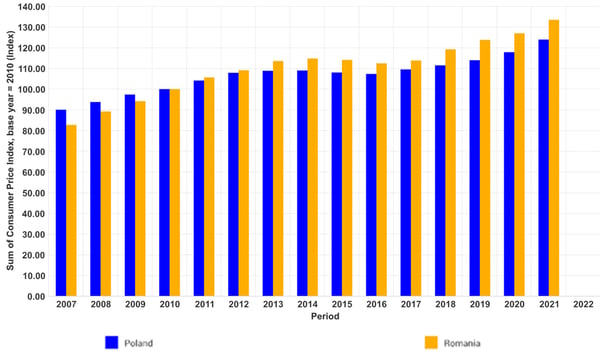
Poland and Romania have been experiencing the slow rise of inflation over this study period. Figure 2 shows the relative inflation as an index of 100 for the base year 2010. Poland's inflation rate was 2.1%, and Romania's inflation was 3.8% in 2019. Note that the yellow (Romania) index bars are outpacing the blue (Poland). These figures do not include the expected sharper inflation anticipated rates due to the 2022 global supply issues from Covid-19 and energy costs increases from the Russian invasion of Ukraine.
Figure 2: Poland and Romania Inflation Trend
 Source: FisherSolve
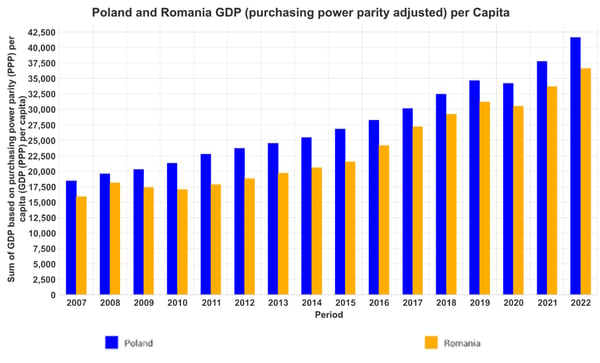
Figure 3 shows the trend of adjusted real GDP growth for Poland and Romania as GDP per capita that can be directly compared on the same scale. Romanians are slightly behind the Poles in personal purchasing power. Poland's overall Real GDP was $1,223 billion in 2020, with a growth rate of 4.55% in 2019. Romania's real GDP was $556 billion in 2020, with a growth rate of 4.2% in 2019.
Figure 3: Poland and Romania's GDP (adjusted) per Capita
 Source: FisherSolve
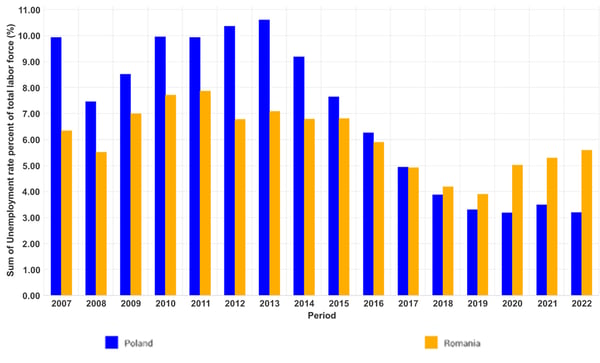
The unemployment rate for both countries is shown in Figure 4. Both countries recovered from the Great Recession, but Romania has seen an upward trend in the past five years that has not affected Poland. Poland also reported unemployment of 10.8% youths (ages 15-24), while Romania is higher at 17.3%. These economic statistics show relatively flat populations with rising per capita incomes. Poland appears to be ahead of Romania in industrial development. Still, both countries are starting from a low point in 1990 in developing a consumer-driven product economy that includes increasing tissue consumption. There is room to grow as domestic tissue consumption approaches the average per capita of the European Union.
Figure 4: Poland and Romania's Unemployment
 Source: FisherSolve
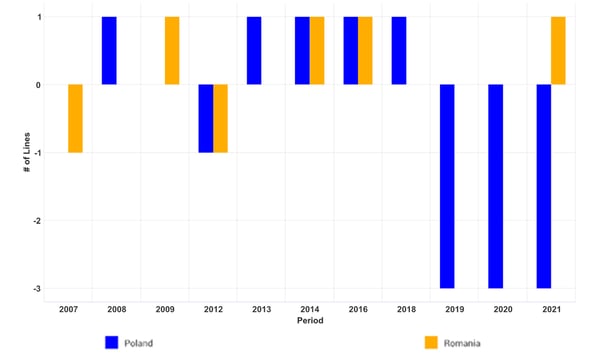
Poland and Romania have been growing and upgrading their tissue machine fleets as shown in Figure 5. Poland has made the most changes by adding five machines and removing 10 over the period the study was conducted. This net loss in the number of machine units masks an increase in total capacity as small, older machines are replaced with larger, more modern machines. Romania has added four machines while removing two over the same time frame. As a result, Romania tends to have newer yet smaller machines.
Figure 5: Poland and Romania Tissue Machine Count Trend
 Source: FisherSolve
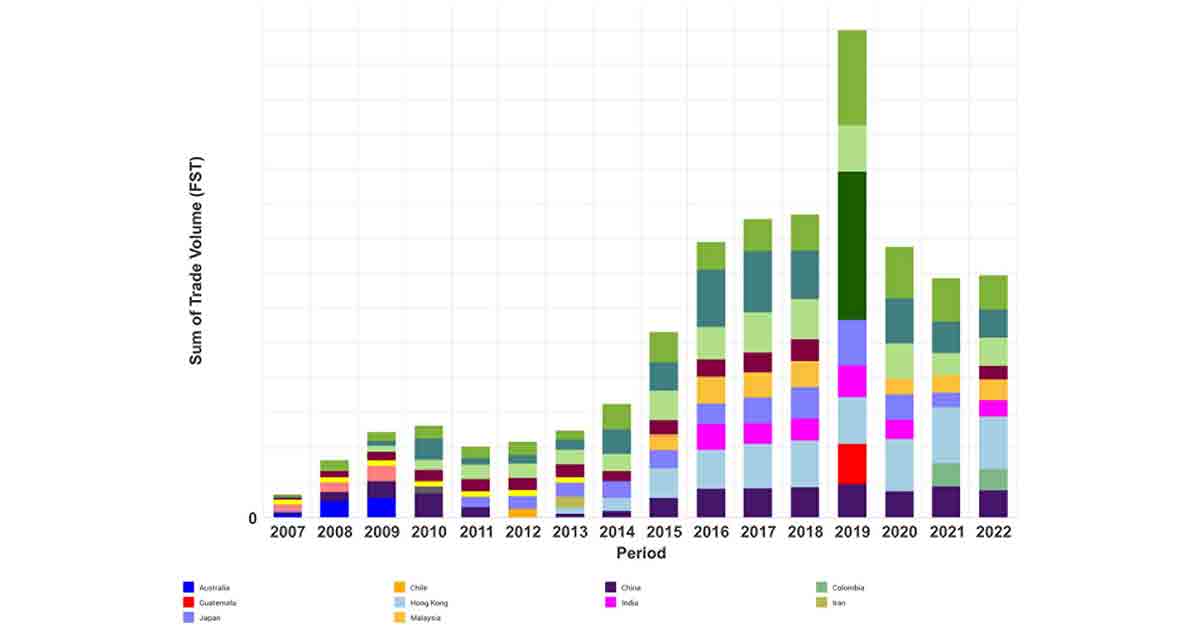
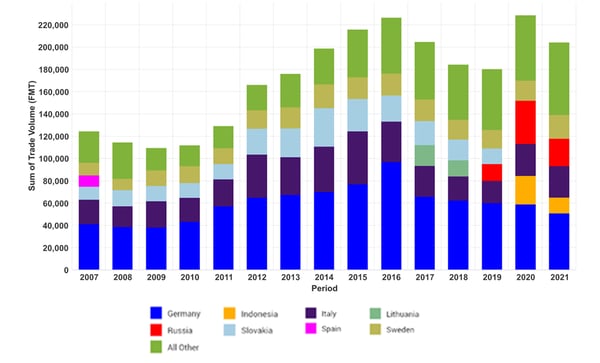
Poland's tissue imports are shown in Figure 6, with the top 10 countries shown as stacked bars. Germany is the leading supplier of imported tissue to Poland, but volumes decrease as Poland's tissue production increases.
Figure 6: Poland Tissue Imports Trend

Source: FisherSolve
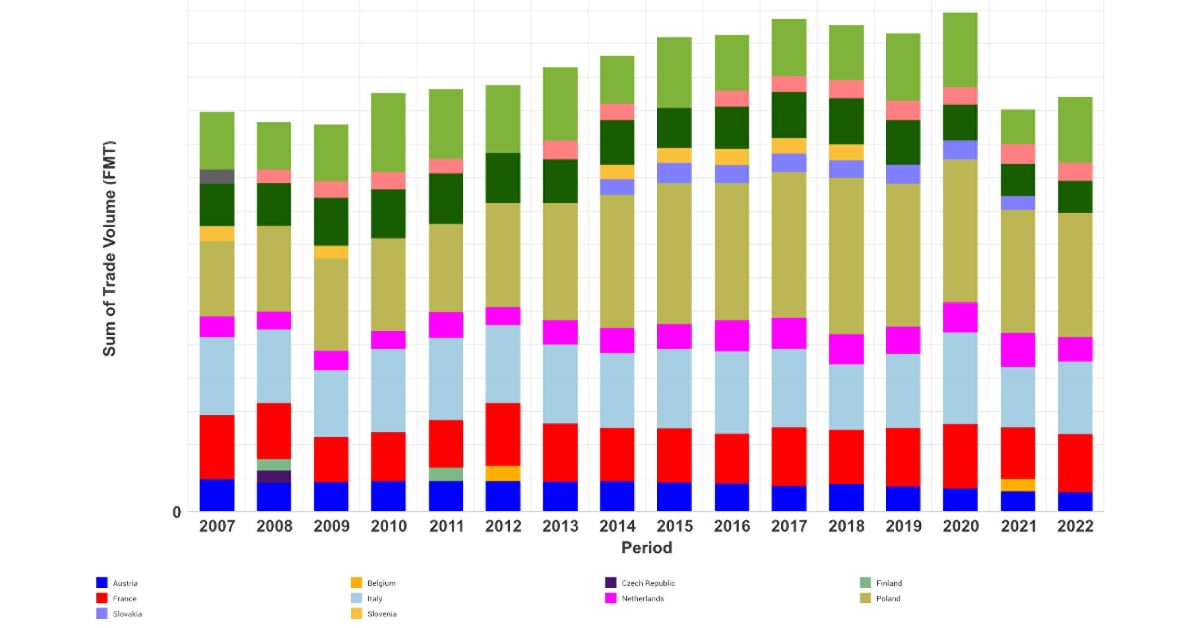
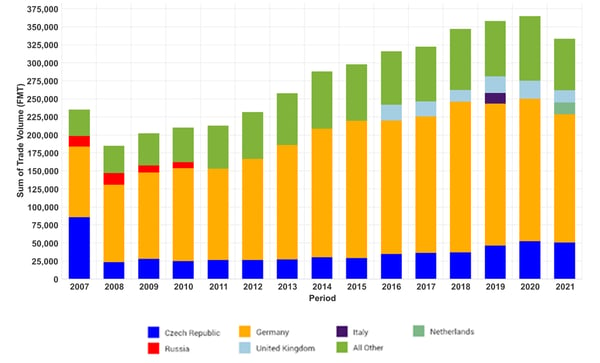
Romania's tissue imports are comparable to Poland, with Germany as the key supplier, as shown in Figure 7. In addition, both Romania and Poland show limited sourced tissue from Indonesia in the last several years. Poland's tissue export trend is illustrated in Figure 8, and again, Germany is the largest trade partner. Poland's overall tissue export volume has grown beyond its tissue imports, making Poland a net tissue exporter.
Figure 7: Romania Tissue Imports Trend
 Source: FisherSolve
Figure 8: Poland Tissue Exports Trend
Source: FisherSolve
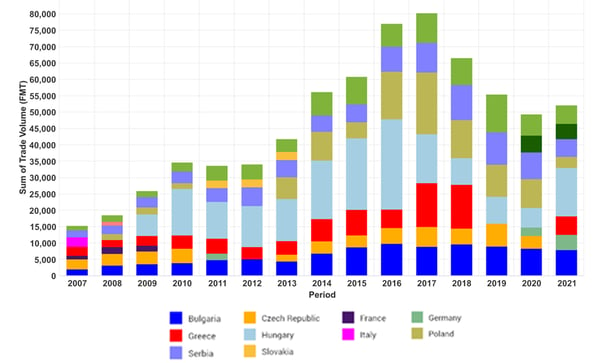
Romania's tissue export trend is shown in Figure 9, with Hungary as the leading tissue customer. However, the volume is much more fragmented than the Polish tissue business. Nevertheless, Romania remains a net tissue importer.
Figure 9: Romania Tissue Exports Trend
 Source: FisherSolve
Figure 10 provides a view of the Polish tissue business with capacity shares shown for each producing country. There are two companies with large shares that account for more than half of the capacity, three moderate share companies, and about 13 smaller share companies. These companies are locally based and include French, German, and Swedish companies.
Figure 10: Poland Tissue Producer capacity Share, Mock-Up
 Source: FisherSolve
Romania's tissue capacity is less fragmented, as shown in Figure 11, but one company has almost 50% of the total tissue capacity. In addition, there is at least one foreign-owned company (French) in Romania.
Figure 11: Romania Tissue Producer Capacity Share, Mock-Up
 Source: FisherSolve
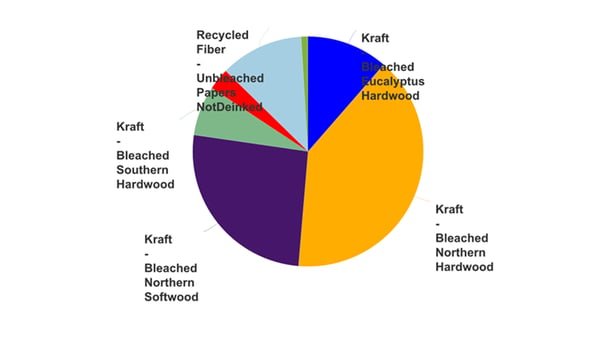
The majority of Poland's fiber comes from imported bleach kraft market pulp consisting of eucalyptus, northern hardwood, northern softwood, and southern softwood. Recovered papers make up less than a quarter of the total fiber furnish, as shown in Figure 12.
Figure 12: Poland Tissue Fiber Sources
 Source: FisherSolve
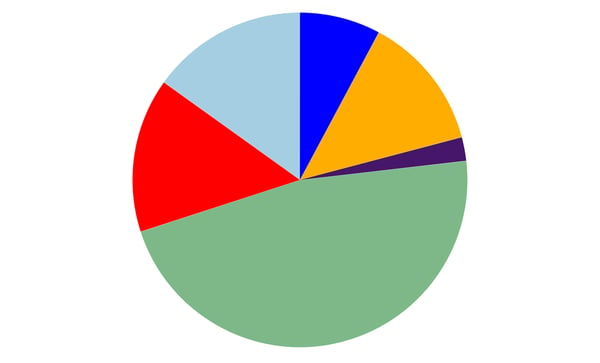
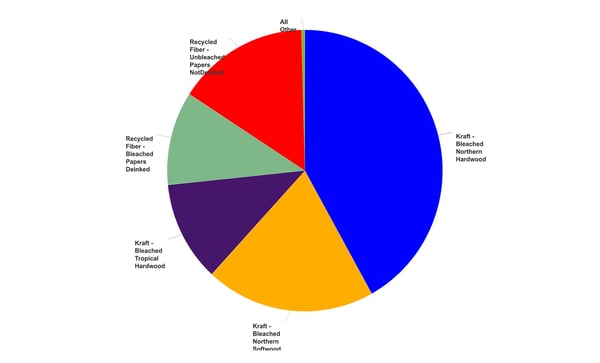
Romania's fiber sources are shown in Figure 13. Here, recovered papers make up slightly more than a quarter of the total fiber furnish. Kraft bleached market pulps include northern hardwood and softwood with tropical hardwoods other than eucalyptus.
Figure 13: Romania Tissue Fiber Sources
 Source: FisherSolve
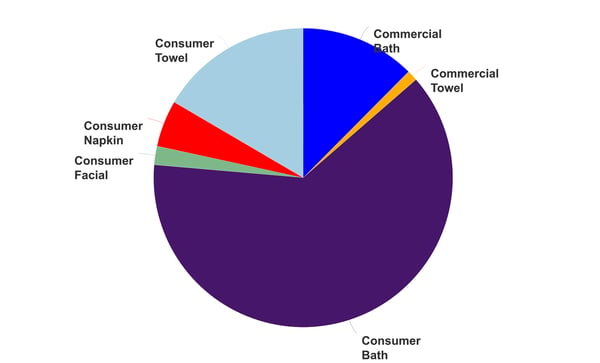
Poland's tissue production is about half consumer bath tissue and a third of the total consumer towels. Commercial hand towels make up the next largest segment. Poland is well known for its industrial demand for hand cleaning products.
Figure 14: Poland Tissue Products
 Source: FisherSolve
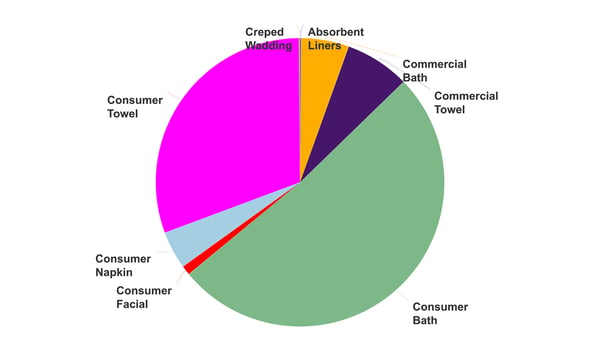
Romania's tissue production mix is shown in Figure 15. Consumer bath tissue makes up an even greater percentage than in Poland. Consumer towel is the second-largest product, but it represents a smaller portion of Romania's total. This suggests that Romanian consumer demand is slightly less advanced than in Poland. The amount of commercial bath tissue versus commercial toweling is surprising.
Figure 15: Romania Tissue Products
 Source: FisherSolve
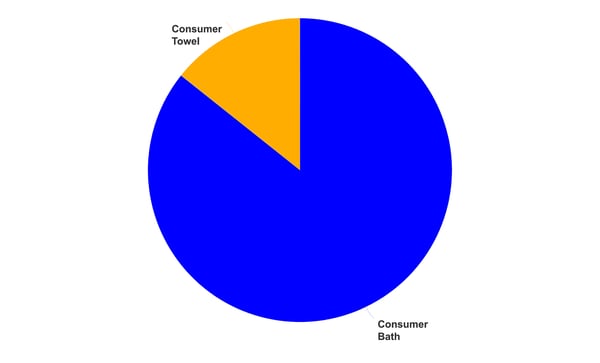
Poland also has some advanced tissue capability to make wet-texturized products. These are primarily focused on consumer bath and toweling, as shown in Figure 16.
Figure 16: Poland Advanced Tissue Products
 Source: FisherSolve
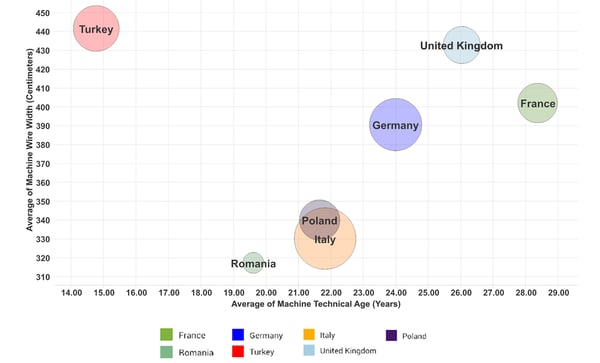
Figure 17 provides an assessment of the average tissue machine quality in Poland and Romania compared to several well-known tissue exporting and importing Western European countries and Turkey. The X-axis of the bubble chart shows the average tissue machine technical age, while the Y-axis shows the average machine wire width. This provides an idea of machine size, productivity, and quality.
Figure 17: Poland and Romanian Tissue Machine Average Quality
 Source: FisherSolve
The bubbles' size represents the relative total tissue production capacity for each country in the comparison. Turkey has the most modern and highest capacity tissue machines in the group. Whereas Romania's tissue machines tend to be relatively up to date, but are very narrow, indicating low capacity per machine. Poland's technology and size compare well with Italy, but at a significantly lower overall national capacity.
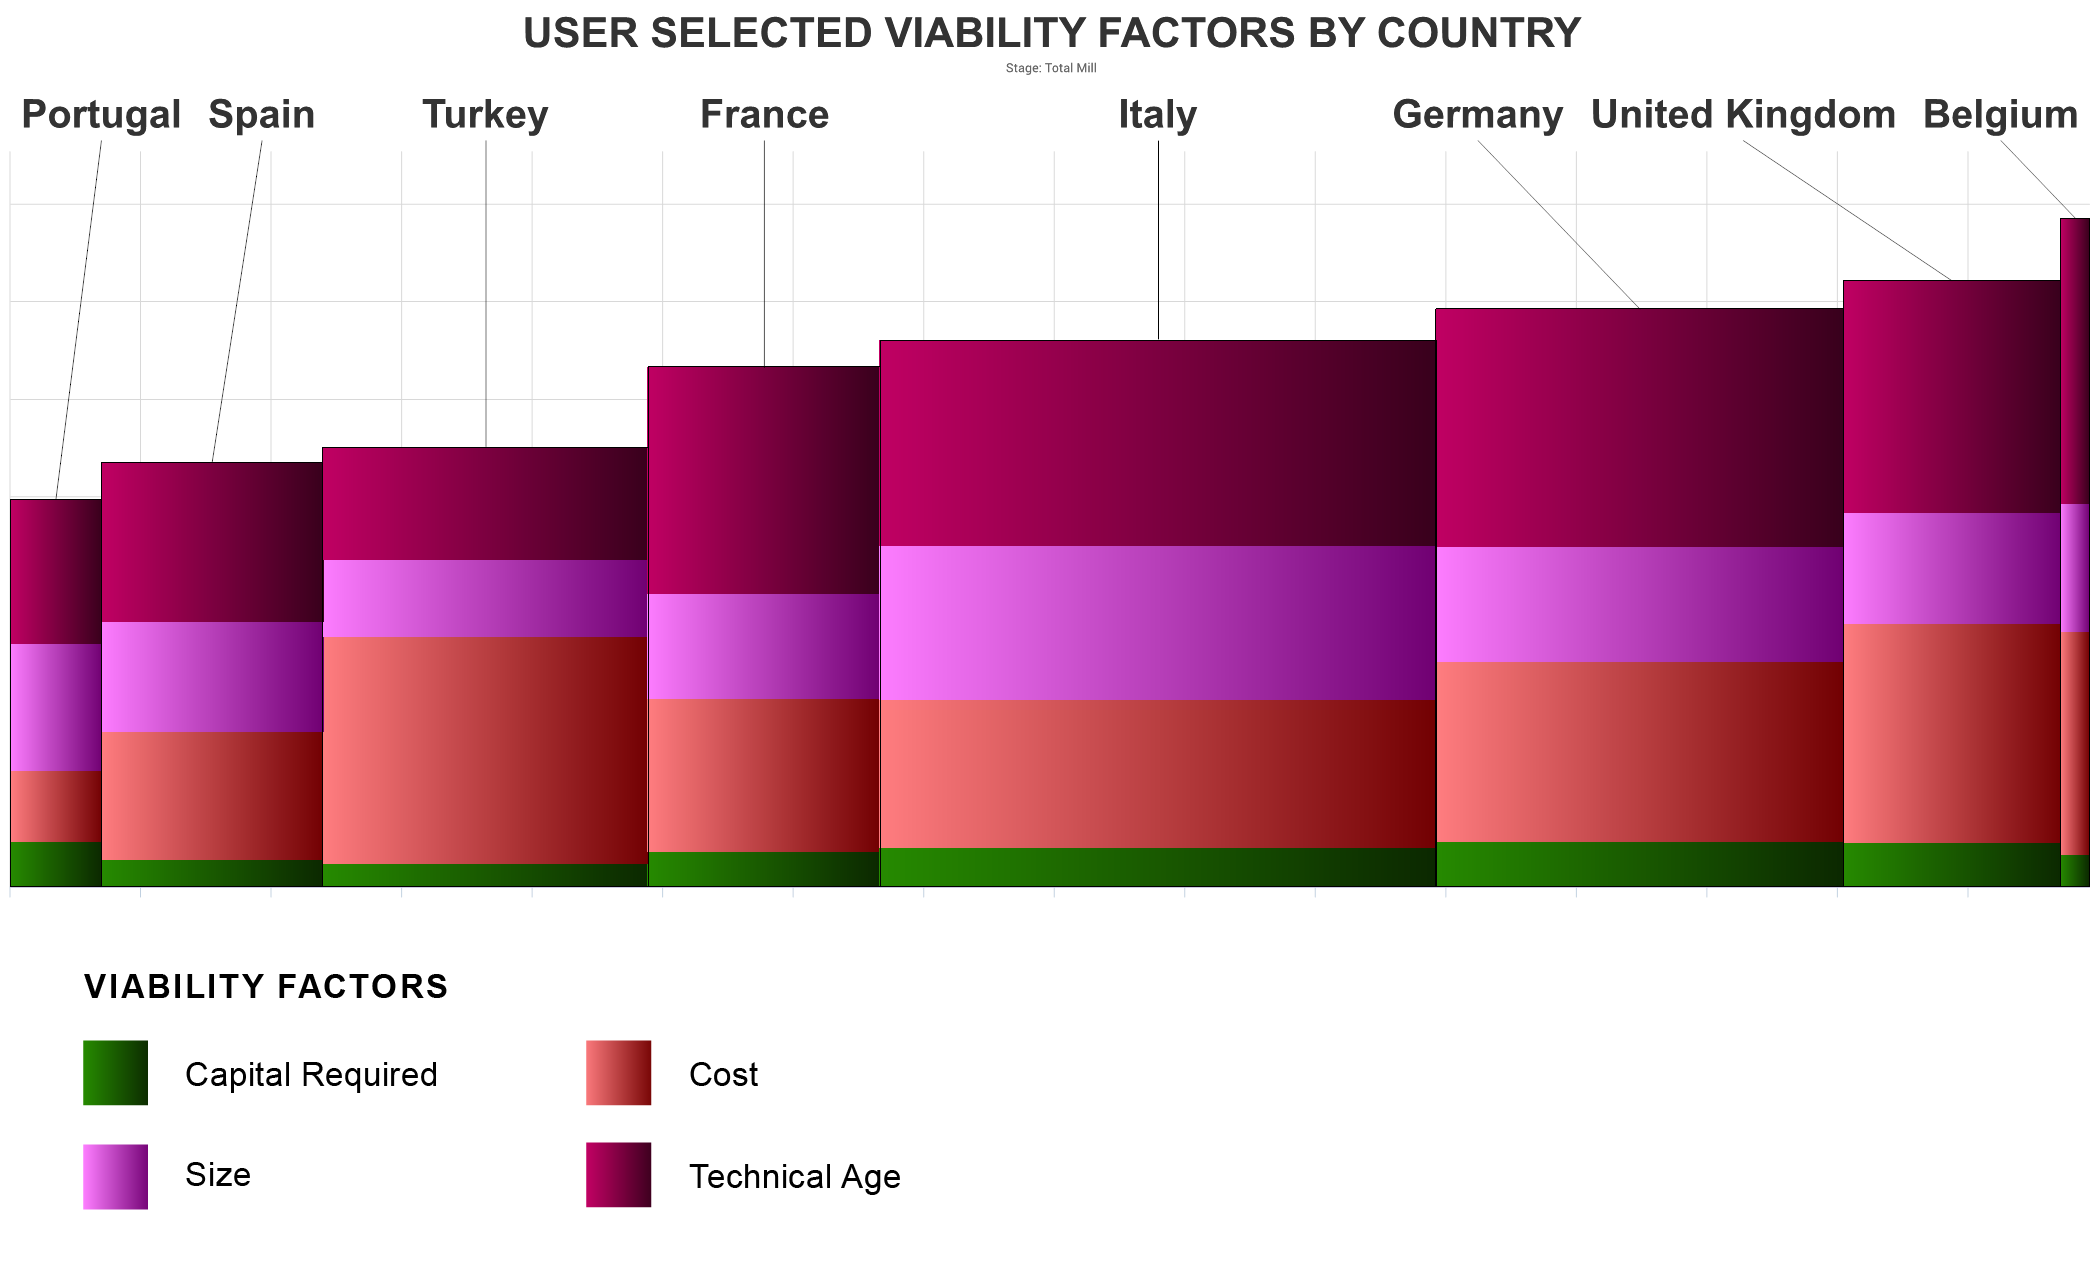
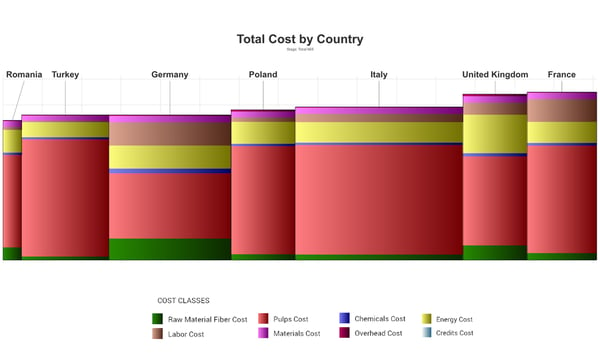
This comparative analysis is continued in Figure 18, showing the average total cash cost of production per tonne for the same group of countries with no significant overall advantages. These total costs are relatively equivalent but show substantial differences in the cost components. Turkey has high virgin fiber import costs, most likely due to currency exchange costs; the United Kingdom's energy costs are about twice the cost per tonne of the others; France and Germany show high labor costs; Germany uses more recovered and recycled fiber in tissue; and both Romania and Poland have lower labor costs but are still higher than Turkey.
Figure 18: Tissue Machine Cost Benchmark
 Source: FisherSolve
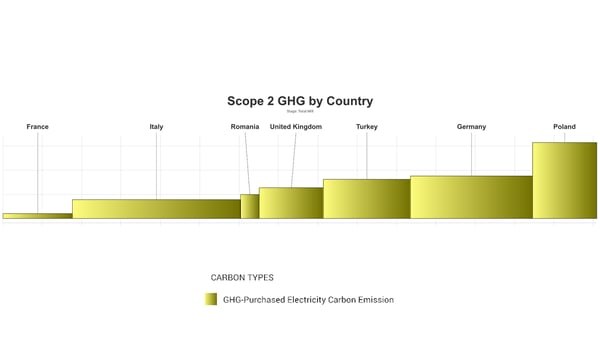
As Poland and Romania's tissue businesses look west to the rest of the European Union, carbon emissions per tonne will become an increasing concern. The FisherSolve Next Carbon Benchmark model allows the evaluation of a product or site by both cradle-to-gate and gate-to-gate carbon emissions. It also provides the direct calculation of Scope 1, 2, or 3 emissions used in many carbon accounting regulations. Figure 19 shows the Scope 2 carbon emissions of each comparison company as that is the most significant difference between them. France has the lowest Scope 2 emissions due to its carbon-free nuclear power. Romania is in the middle of the group, but Poland is an outlier due to coal's heavy power grid use. This is expected to become a significant factor hindering the growth of Poland's tissue exports to other EU markets.
Figure 19: Tissue Machine Scope 2 Carbon Dioxide Emissions Benchmark
 Source: FisherSolve
Poland and Romania have grown their domestic tissue consumption and production over the past two decades as the countries developed free and market-based economies. However, they are both losing populations due, in part, to the departure of skilled workers and young people moving to other EU countries. Both countries have room to grow the consumer use of tissue products At-Home and AfH. As tissue imports continue to exceed its exports, Romania's tissue manufacturing sector capacity is less than the total tissue demand. Poland's tissue manufacturing is more advanced, including new advanced tissue technology for texturized tissue and is able to support net tissue exports. Poland also has more investment from international tissue-making companies, and Poland's fragmented tissue market suggests that there is room for industry consolidation.
Other than the enormous carbon footprint of Poland's tissue manufacturing due to grid power generation, both countries' tissue manufacturing should be viable for the future as they look for continued integration with the European Union. However, none of the factors discussed or data used in this analysis take the most recent events impacting the global economy into account. The continued global supply constraints and rapidly spreading inflation will influence tissue operating costs. The Russian-Ukraine conflict puts both Poland and Romania on the front-line regarding risk to their economies and energy supplies. Energy prices have spiked across Europe, and while Poland has access to ocean LNG shipments, Romania is landlocked. Both countries will need to look for adaptations to on-site and purchased energy supply to manage cost and carbon emissions versus the rest of the European Union.
Analysis of competitive position requires specifics on tissue producers and individual machines. This article presents a static summary of Poland and Romania's tissue industries today. Fiber prices, exchange rates and environmental regulations will change, providing some participants with advantages and new challenges. In addition, Poland and Romania's tissue mills will continue to change hands and consolidate, and neighboring countries may invest in tissue-making capacity, affecting Poland's and Romania's imports and exports.