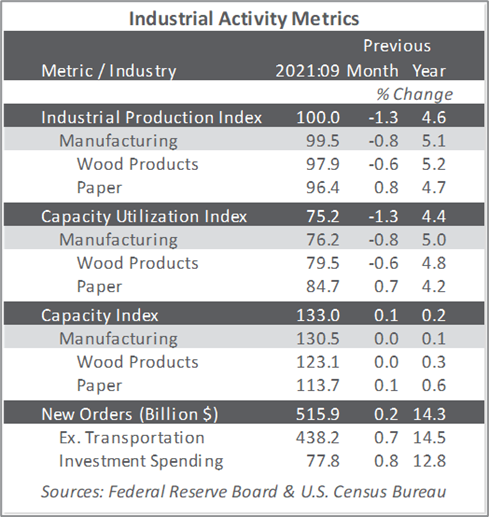
Standard economic theory holds that prices are determined by the intersection of supply and demand. As the theory goes, one only needs to understand the shape of the demand curve (that is, the quantity of goods consumers are willing to buy at a given price) and the shape of the supply curve (the quantity or volume suppliers are willing to sell at a given price) to find the price. According to this theory, the intersection occurs when buyers and sellers negotiate the price down to the marginal producers’ cost level. The rationale is that marginal (or high cost) producers would rather walk away from an order than sell below cost. The theory is illustrated by Figure 1.
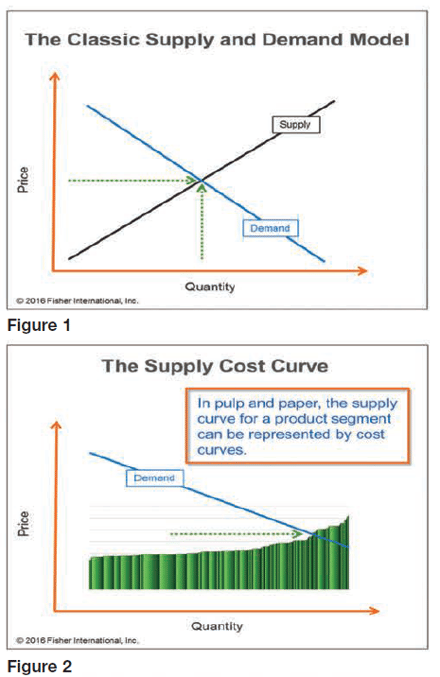 In pulp and paper, the supply side is well-understood from cost curves. For instance, FisherSolve™ Next cost curves can produce any combination of market segmenting factors from geography, finished product, furnish, and machine type to hundreds of other factors drawn from FisherSolve’s rich, integrated database. This is illustrated in Figure 2 where the demand line and supply line (cost curve) intersect. For any and every market segment, we can definitively define supply and its marginal cost. But, while this allows one to answer supply questions and a very wide range of other related strategic questions, it still isn’t enough to explain how and why prices move, especially in the short term where most buying and selling happens.
Forecasting prices using supply and demand theory (called “econometrics”) is used nearly universally by today’s pulp and paper industry analysts — and it sounds compelling. The only problem with the theory is that prices in the pulp and paper industry rarely behave this way.
Overly simplistic analysis of how prices behave can lead to poor business decisions that have disastrous consequences. For example, we read recently about an idea that business leaders can “shape” the supply curve (by shutting “mid-cost” mills instead of higher cost mills) — an idea that would seem to make sense if the econometric supply-demand theory of price behavior were true — can be shown to lead to dramatic losses of market share, competitiveness, and profitability.
Econometrics also produces the common wisdom that changes in manufacturing costs drive market prices up and down. We saw such an assumption embedded in the profit-ability projections for a major paper producer — who has since been taken over by another company —leading to the conclusion that rising costs would not hurt profitability!
So, how do we know that the supply-demand theory isn’t reliable when put in practice in pulp and paper? If prices were really determined by marginal producers’ cost levels, market prices would always be at that level. When costs went up, prices would rise; when marginal producers’ costs went down, prices would fall. The implication of this is that the margins of marginal producers would always be approximately the same. But they aren’t. Just take a look Figure 3, which shows North American coated freesheet, prices, marginal costs, and marginal supplier margins.
Buyers and sellers establish prices according to their speculation about each other’s relative power in the negotiation and their ability to get what they want.
We can see from the chart that sometimes costs do influence prices, during time periods B and D when prices were at or below the marginal cost of production (we call this the price floor). During these periods, marginal costs do have an impact — in some cases rising costs will push prices up, in other cases, negative margins will drive mills out of the market, altering the supply and demand balance, also pushing prices up. In other periods (A and C), we see that margins were much higher, but at different levels. In these cases, suppliers had varying levels of strength in the price negotiation.
So why does supply-demand theory fall short for predicting price? There are many reasons. One is that, in the short run (which is where we all live, right?), buyers and sellers negotiate prices up and down based on concerns other than simply what it costs a handful of producers to make the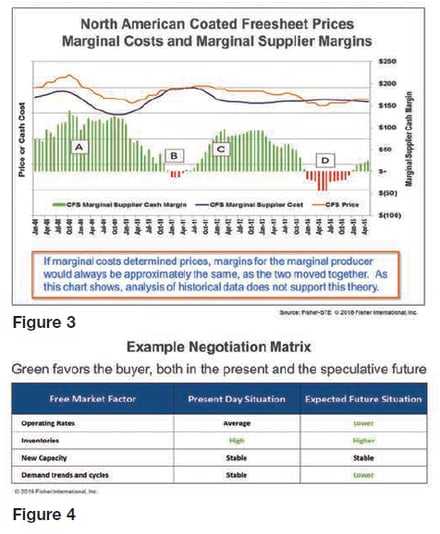 products. Those producers’ willingness to operate at a loss for a period of time also affects pricing behavior. Moreover, a simplistic use of cost curves could convince one that the marginal price is the same in all markets. The truth is that not every producer bids on all business, making price behavior more complex to predict. Pricing decisions made over the negotiating table are also influenced by factors such as changes in lead times, fear of shortages, buyers stocking up in front of price increases, and many other psychological effects. These cause prices to fluctuate for rational reasons according to other factors than pure supply-demand analysis would suggest.Buyers and sellers establish prices according to their speculation about each other’s relative power in the negotiation and their ability to get what they want. These “free market” forces, are heavily influenced by the changing dynamics of the present market and each participant’s speculation of the future. Buyers and sellers establish prices when they each assess their own relative bargaining power, speculating on market forces such as:
 - Operating rates
- Inventories
- Costs
- End-demand
- Capacity changes
- Order backlogs
- Shipments
Industry participants use every available piece of information to them to determine their relative selling or buying position. This “mental” game can be represented in simplified form with the scenario presented in the following matrix. What if today’s market looked like this (Figure 4): What would be the real-world outcome? The buyer, believing that inventories are currently high, with a prospect of weaker future industry operating rates, asks for a discount from his supplier to keep his business. The seller, believing the same (they both read the same multi-client industry reports, after all), speculates as well — he’d rather lock the volume now (and for the coming year) at lower prices than lose volume in the future. The buyer, fresh from victory, goes to his other suppliers of like products who, finding that a competitor has lowered prices, lower theirs as well, confirming everybody’s speculative belief about the future, even though nothing is different from the day (or week) before: aggregate end demand is roughly the same, as is the shape of the demand and supply curve and cost level of the highest cost mill. This point is well illustrated by dissolving pulp price cycles (Figure 5).
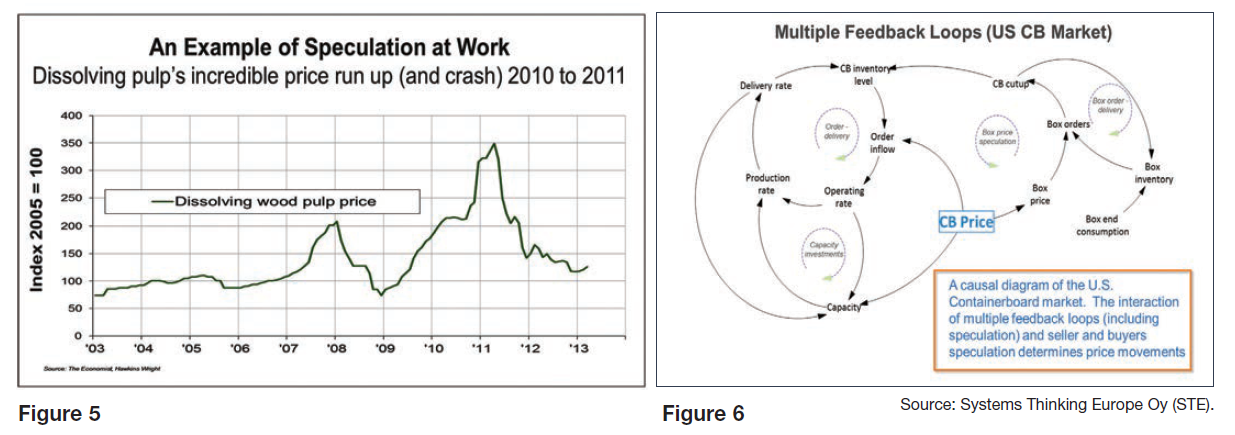
The fact is, markets work not by the simple intersection of two linear equations, but by a complex interaction of various feedback loops (Figure 6). Econometric models of supply and demand do not do well in forecasting prices in the short run because they do not take into account the feedback loops that make up every marketplace. Forecasting prices and their turning points is hard unless one has the ability to simulate how the market behaves: the interactions of buyers and sellers and all the mental “rules” that real-world participants use when they negotiate prices.
Above, we described one feedback loop where the price changed without supply and demand changing. Another classic feedback loop example is interaction between price and supply. At higher prices (and higher margins), new capacity can be pulled into the market. In part due to economies of scale, the paper industry nearly always over-builds to future expectations (think of how an actual cost curve is stair-stepped, not a straight line), resulting in a future surplus of capacity, which then pulls the price down. Therefore, one can say that the future price is a partial function of today’s price, its direction, and all of the other market factors interacting with each other.
Forecasting prices and their turning points is hard unless one has the ability to simulate how the market behaves.
In an ideal world, the rational econometric model should be all that we need. But in the real world where our transactions take place, to predict how prices will behave, one has to capture and model how people have and will speculate about the future and how those speculations will affect buyers’ and sellers’ behaviors. And then how those behaviors will affect their next set of speculations and their subsequent reactions. And so on. Using simulation produces a more accurate and reliable predictor of prices and price turning points and allows us to explain when the market’s turning points will occur, why the market behaves as it does, and what will happen when big events occur or when participants take big actions.
It shouldn’t be surprising that a too-simple understanding of paper industry markets can’t support useful business strategic thinking. More productive would be the use of the latest industry research, math, and technology to create realistic business models that show the consequences of a business’s strategic choices. There are accessible opportunities that the industry’s producers and suppliers can exploit through proper use of advanced business intelligence resources and common sense. We invite you to talk with Fisher about the insights you need and how to unlock the full potential of your assets and investments.

Matt Elhardt is a Strategic Planning professional with 20 years of pulp and paper industry experience in sales, marketing, product development, and operations. His area of expertise is identifying growth potential and achieving performance end-goals through strategic management, pricing and margin optimization, and anticipating marketplace dynamics.
(This article originally appeared in the May/June issue of PaperAge Magazine)