The Middle East has some of the world’s oldest recorded history and has played a significant role in developing human language, agriculture, laws and religion for over 5,000 years. The region has been the source of rotating empires as many wars for power have occurred. However, despite a long-shared history, today’s divisions between peoples and states appear greater than almost any region on earth. These were exacerbated by colonialism and differing early 20th century mandates after World War I. Political factors, not geography, are what determine intraregional economic cooperation and trade, which must be considered to analyze tissue demand and production in the region.
The component countries that make up the Middle East are not well defined and vary by political definitions instead of geographical ones. While statistical sources use several different definitions, this report considers Bahrain, Egypt, Iran, Iraq, Israel, Jordan, Kuwait, Lebanon, Oman, Palestinian Territories, Saudi Arabia, Syria, UAE, and Yemen as the countries of the Middle East. Table 1 provides a summary of key differences in the region derived from the World Factbook. In this case, the Palestinian Territories are broken down separately as Gaza and West Bank.
Table 1: Middle East Economic Statistics Supporting Tissue Demand Growth
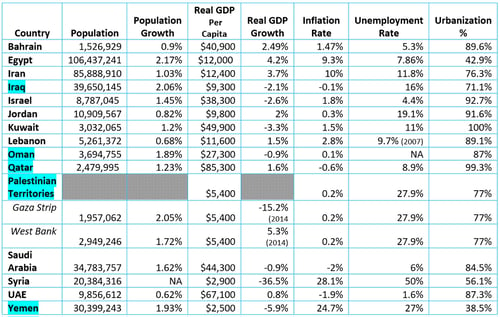 It would be hard to find another region of the world with as significant of a variation in economic statistics as the Middle East. The range of real GDP per capita shown in Table 1 illustrates Qatar at 34 times the level of Yemen. Some of the statistics shown are relatively out of date and, in some cases, unavailable. It should be noted that the specific data available for the Palestinian Territories are combined, but some are separated as shown. While the more internationally active countries’ data is typically from 2020 or 2021, most of the economic information is from 2017. This excludes the effects of the pandemic and some other catastrophes that have occurred, such as Lebanon’s warehouse explosion. Any data that is further out of date is noted in the table. In some ways, it is worse than it looks for supporting tissue demand in several countries, as there are no tissue machines in the countries identified in the light blue region in the table above.
Figures 1-4 show some of the same data as trends available from Fisher International. Figure 1 shows Egypt’s population growing significantly faster through the 14 years compared to the others. Iran, Iraq, Saudi Arabia, and Yemen are other larger populations, but the rest are minimal, and Syria stopped reporting data as of 2010.
Figure 1: Middle East Population by Country
 Figure 2 shows the trend of purchasing power parity GDP per capita during the same time frame. The large swings in GDPR from oil prices during the recovery period from the last global recession had an enormous effect on oil-producing countries like Qatar, who is at the top of the chart. Other countries, like Yemen, just became poorer during their civil war. This has resulted in a challenging environment for the growth of tissue demand and tissue production in the area. The United Arab Emirates, however, appears to be more diversified and did not respond to oil prices in the same way.
Figure 2: Middle East GDP per Capita
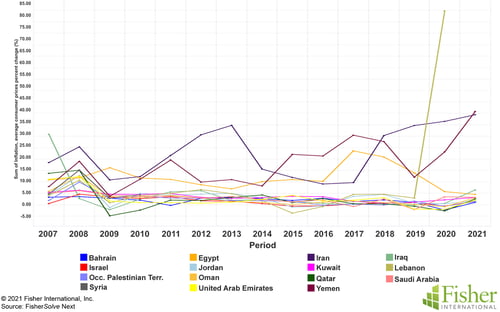
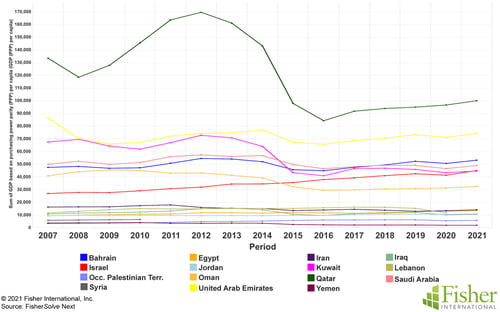 Figure 3 shows the trend of inflation. This shows inflation swings in countries with unstable economies due to civil wars and trade difficulties. Lebanon stands alone with the last inflation report at 84.9% at the end of 2020. Iran and Yemen also show significant inflation problems, while Egypt has returned to more normal operating rates. The unemployment rate trend data is more difficult to obtain in closed societies.
Figure 3: Middle East Inflation
 This is seen in Table 1 and illustrated in Figure 4 as fewer countries have statistics to be reported. The Occupied Palestinian Territories suffer from long-term unemployment. Jordan shows a significant increase in unemployment over this term as well. Saudi Arabia, Kuwait, Israel, and Bahrain have seen stable or falling unemployment rates. Syria stopped reporting in 2010.
Figure 4: Middle East Unemployment
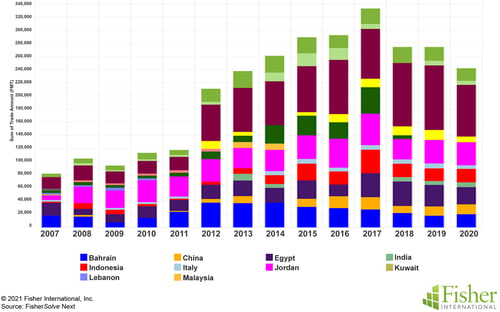
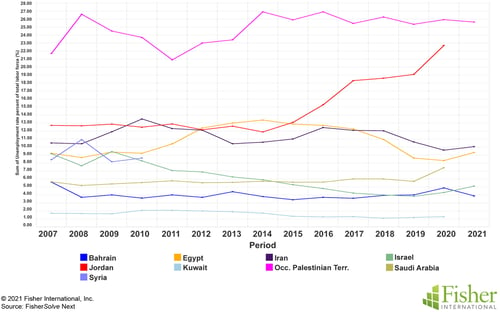 Figure 5 shows the tissue imported into the Middle East by each reporting country. Total imports by the Middle East have grown from about 10% to 20% of the total production in the region. Most of that tissue is being imported by Saudi Arabia.
Figure 5: Middle East Tissue Imports by Country
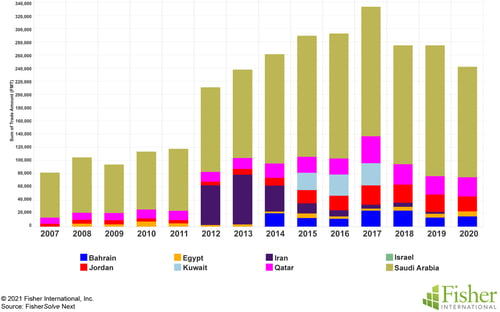
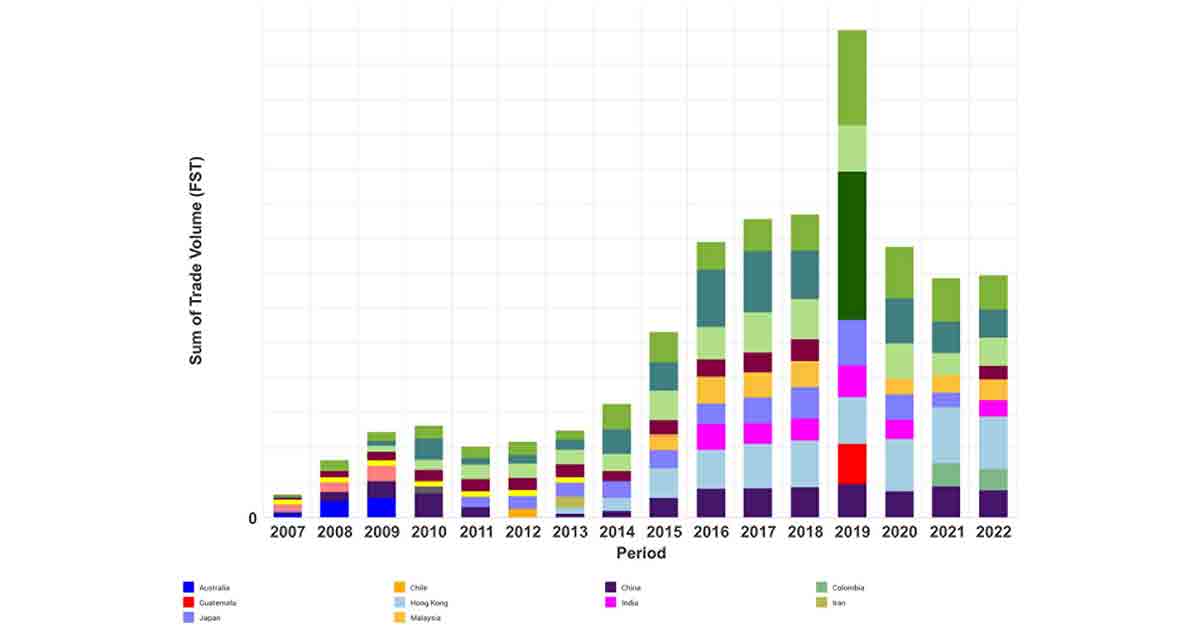
Figure 6 plots the same tissue import data as Figure 5; however, the source of the imports is shown. Unsurprisingly, some imports come from within the region, with Egypt as the leading exporter to the Middle East. Unfortunately, trade data for several of the countries are not available, including Yemen, Syria, and Palestinian territories.
Figure 6: Middle East Import Sources
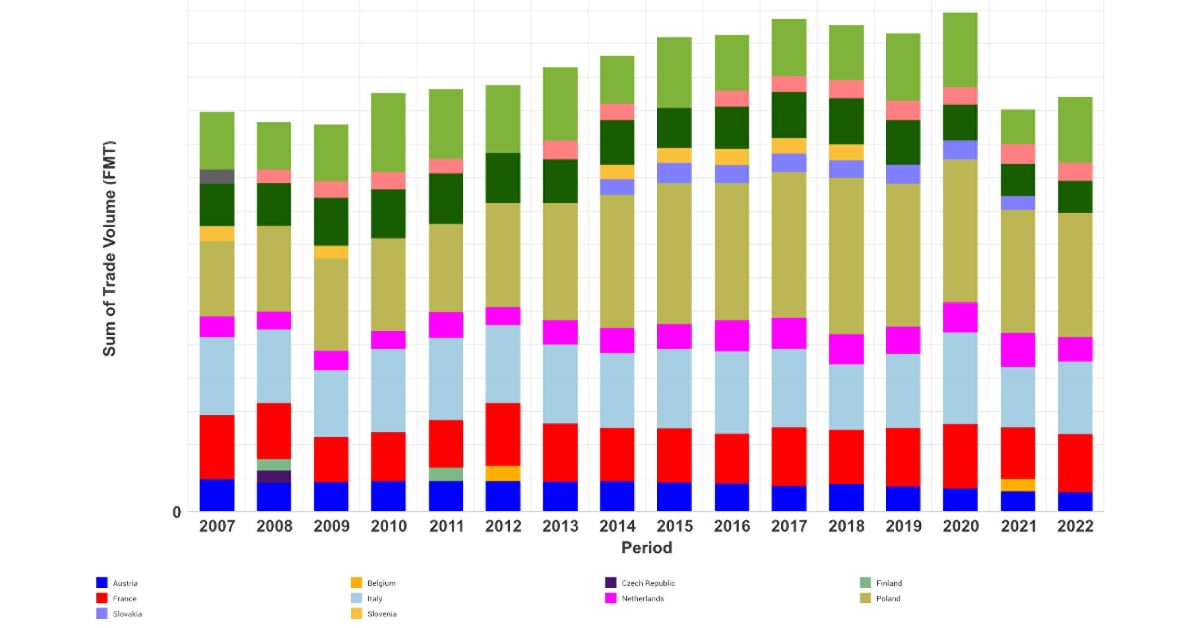
 The Middle East does export some tissue, as shown in Figure 7. While most of this trade is done within the Middle East region, we see some occurring in Europe and the Mediterranean.
Figure 7: Middle East Tissue Exports
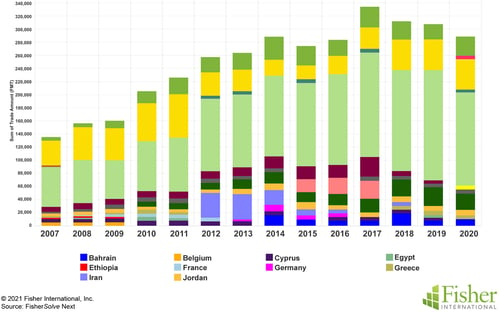 Figure 8 provides a heat map showing the relative tissue production capacity in the Middle East tissue-producing countries. The United Arab Emirates has the largest production capacity, followed by Egypt, Iran, Lebanon, and Kuwait.
Figure 8: Middle East Tissue Production Heat Map
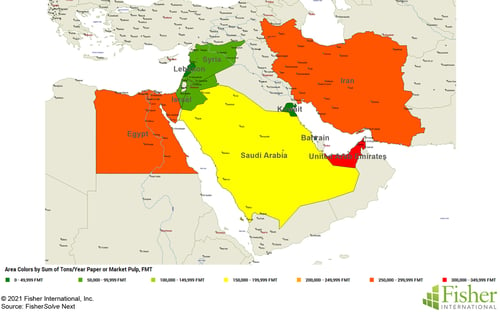 Figure 9 shows the paper machine additions and deletions behind the capacities shown in Figure 8. The United Arab Emirates, Egypt, Iran, and Saudi Arabia have made significant upgrades to their tissue fleet, and Lebanon has taken out tissue capacity. However, Kuwait and Syria have not changed.
Figure 9: Middle East Tissue Machine Additions/Deletions
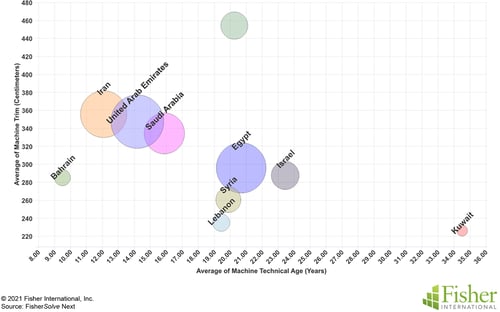
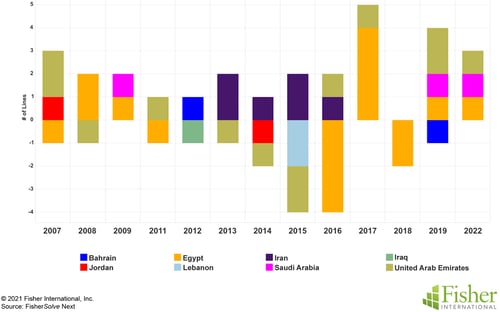 Figure 10 represents the average quality of tissue machines in the Middle East for each of the countries. The bubble size represents the total capacity in each country, with United Arab Emirates, Egypt, Iran, and Saudi Arabia as the top producers. However, Egypt’s machines tend to be older and smaller compared to the other three. Bahrain has the newest machines, but they are small in width. Kuwait has not invested in machine upgrades or replacements. So far, there has been one advanced technology tissue machine in the Middle East, which was installed in the United Arab Emirates.
Figure 10: Middle East Tissue Machine Quality
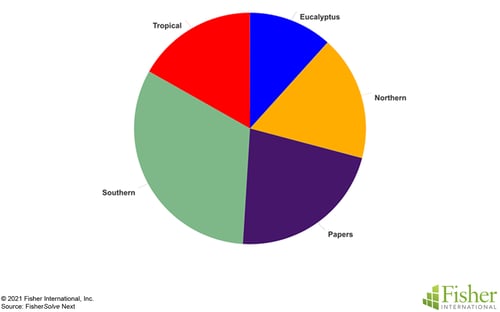
 The composite tissue furnace used in the Middle East is shown in Figure 11. The paper section represents the amount coming from recovered paper fiber. The virgin pumps come from various regions, including southern, northern, eucalyptus, and tropical fibers.
Figure 11: Middle East Tissue Furnish
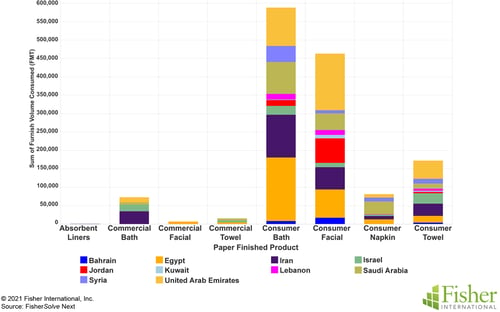
 A composite view of Middle Eastern tissue products produced is shown in Figure 12. Consumer bath and consumer facial are the significant grades produced. Consumer towel production comes in as the number three grade. Israel and Iran are the only countries producing commercial bath tissue. Egypt produces commercial facial tissue, while Saudi Arabia produces commercial towels.
Figure 12: Middle East Tissue Products
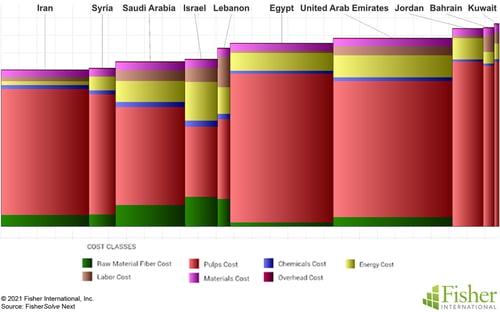
 The relative production costs of Middle Eastern tissue are plotted in Figure 13. Iran has the lowest cost while Kuwait is the highest cost tissue producer. However, this broad range from lowest to highest cost seems smaller than expected. The cost component breakdown shows that every producer uses some recovered fiber except for Jordan, Bahrain, and Kuwait. However, energy costs are much higher in Israel.
Figure 13: Middle East Tissue Relative Production Cost by Country
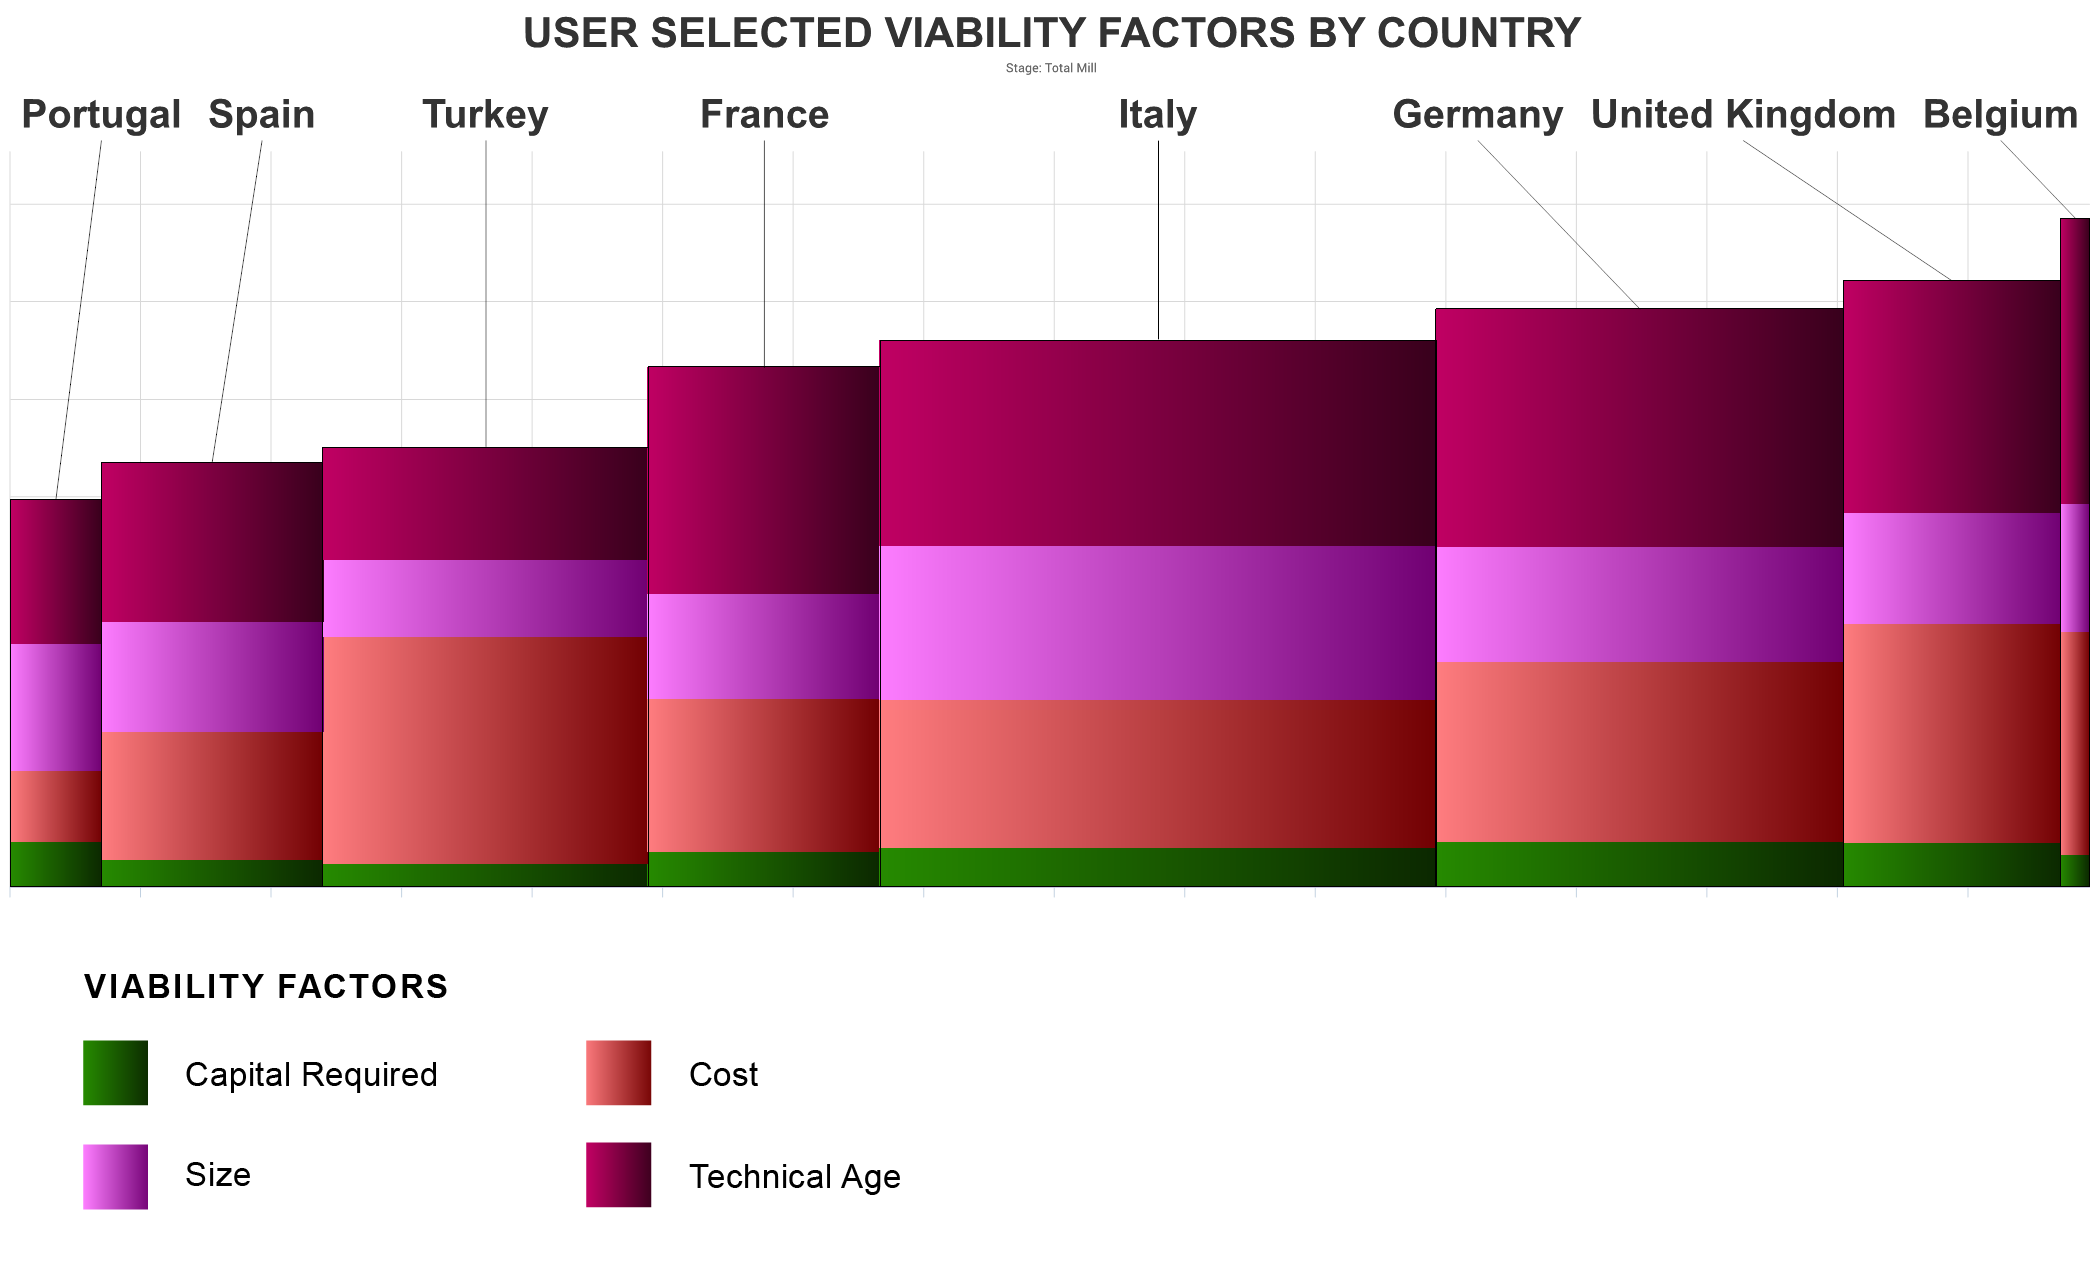
 Fisher International provides a proprietary viability ranking based on each tissue machine’s future expected relative competitive position based on capital required, cost, size, and technological age. Figure 14 shows a broader distinction between the tissue-producing countries in the Middle East than the cost curve in Figure 13. Iran is projected to be the most viable, but the United Arab Emirates’ newer fleet of machines is scored much better than on the cost curve. Egypt’s ranking has improved as well.
Figure 14: Middle East Tissue Machine Viability by Company
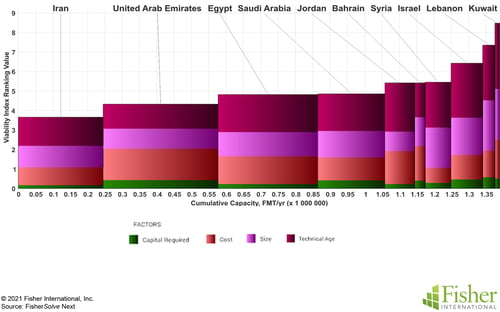
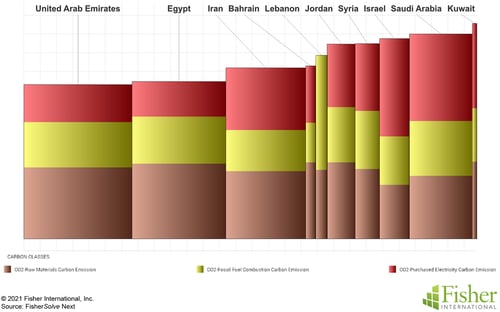
Figure 15 shows the average carbon emissions in a cradle to gate score based on CO2 content in the raw materials, fuel combustion on-site, and purchased electricity. Again, United Arab Emirates, Egypt, and Iran are in the best position, which is probably due to the efficiency of their tissue operations.
Figure 15: Middle East Tissue Machine Carbon Emission by Company
 The Middle Eastern tissue business is a study in contrasts and contradictions. Tissue demand and use growth rates are driven by economics and demographics. This region contains both very high and low personal income with large and small populations. Political factors limit trade within and outside the region. Statistical data on economics and demographics is available in the wealthiest countries, but very limited in the more troubled areas.
Iraq, Oman, Qatar, Palestinian territories, and Yemen do not have tissue machines within their borders, and Syria and Kuwait have not made changes in their tissue fleet in the last 14 years. Bahrain, Iran, United Arab Emirates, and Saudi Arabia have updated their tissue fleet and have the youngest machine technical age. Iran, United Arab Emirates, Saudi Arabia, and Egypt are the major players in volume, followed by Jordan. These are the same five countries with the best viability rankings. The United Arab Emirates appears to be trying to diversify its economy away from petroleum products, which could support tissue production growth and exports in the future.
Analysis of competitive position requires specifics on tissue producers and individual machines. This article presents a static summary of the Middle East’s tissue industry today with limited visibility on several countries due to internal and political issues. Fiber prices, exchange rates, and environmental regulations will change, providing some participants with advantages and new challenges. In addition, the Middle East’s tissue mills will continue to change hands and consolidate, and neighboring countries may invest in tissue-making capacity, affecting the Middle East’s imports and exports.