The proposed SEC reporting schedule will require publicly traded firms, which most tissue and consumer packaged goods (CPG) companies fall under, to report their Scope 1 and Scope 2 emissions data beginning with fiscal year 2023. Going even further, companies will also have to report their Scope 3 emissions beginning with fiscal year 2024.
The Difference Between the Carbon Scope Emissions
- Scope 1 Emissions: The greenhouse gas emissions that a company makes directly from the combustion of fossil fuels or biomass while running its operations or vehicles.
- Scope 2 Emissions: The greenhouse gas emissions a company makes indirectly through the production of electricity or energy it purchases to consume in its facilities.
- Scope 3 Emissions: The other greenhouse gas emissions a company is responsible for throughout the value chain. For example, emissions that are associated with production/transportation of raw materials, production/transportation of fuels, and transportation of manufactured goods.
Scope 3 encompasses a large portion of a company’s emissions due to all the potential contributing sources. It is inherently difficult to estimate because the company does not have control over the assets/processes and must rely on another company to provide accurate information. While there is still a year left until these emissions are required to be reported, this hasn’t stopped most CPG companies from beginning to ask for this information now.
How Could These Reporting Guidelines Impact Tissue Producers?
In the case of tissue producers, these are important numbers to consider and obtain as tissue is such a carbon-intensive sector. As an example, let’s look at the difference between integrated and non-integrated tissue producers.
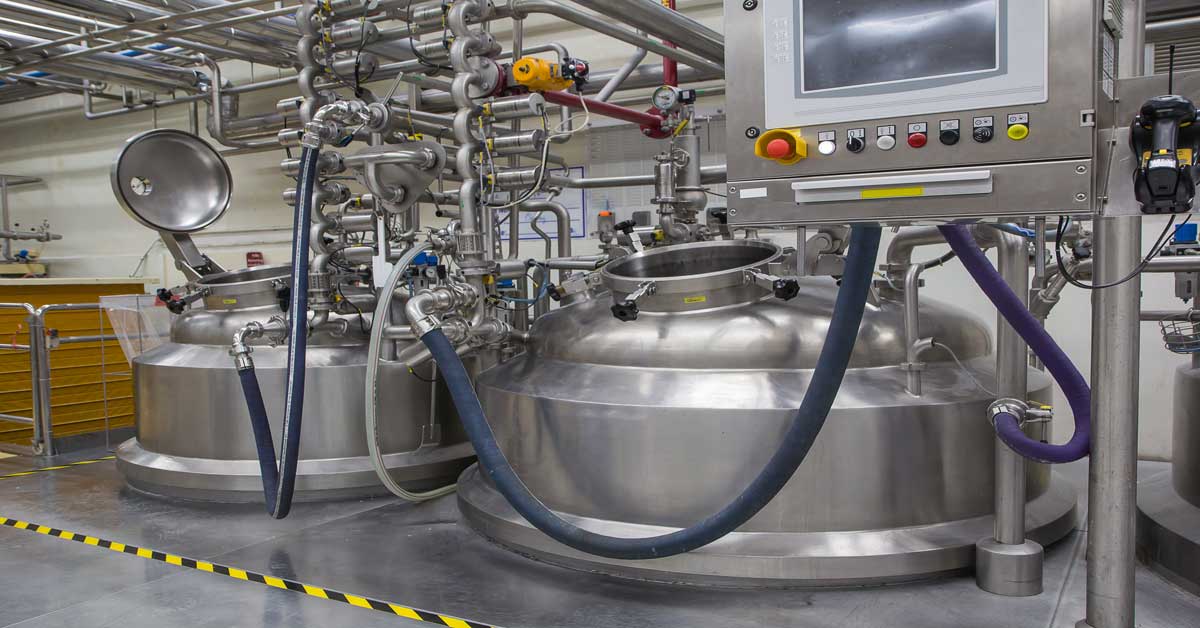
Integrated producers are mills that have fiber pulping capability onsite. This means they are likely to have less Scope 3 emissions since they technically produce most of the product from trees/recovered fiber to pulp to tissue. With nearly everything produced in one location, integrated producers don’t have to account for nearly as many emissions from transportation since the raw materials are onsite.
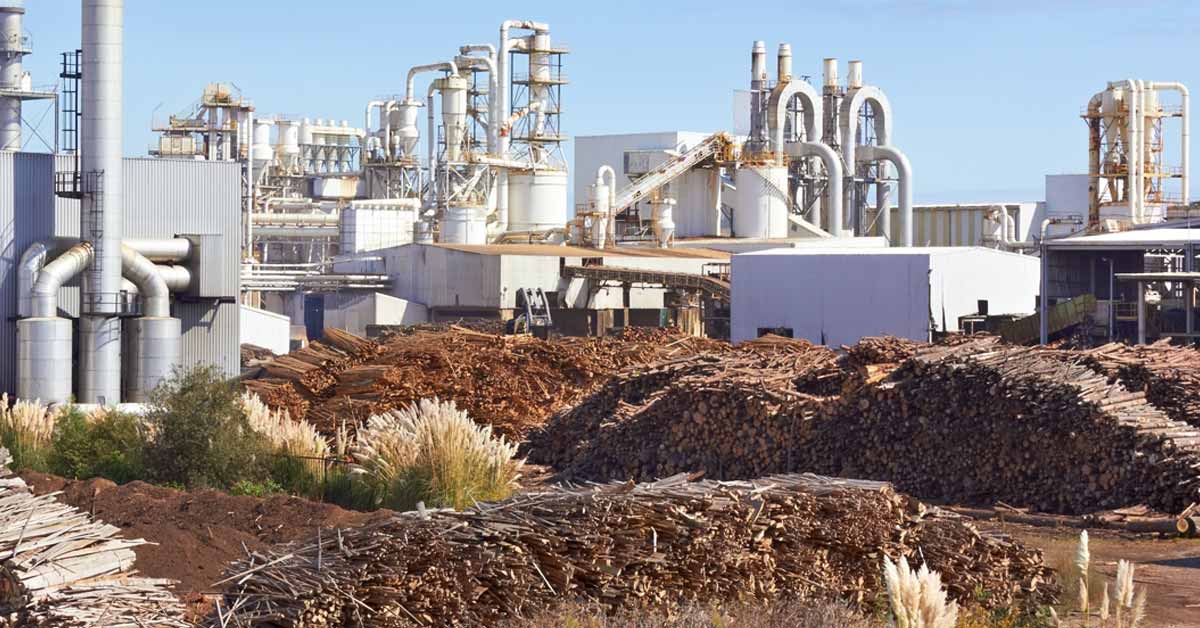
Non-integrated producers will have to account for both their own emissions and emissions from the purchase of externally produced market pulp. With this pulp coming from different facilities across the continent and abroad, there are significant emissions associated with transportation.
As we are getting closer to the implementation of these reporting regulations, companies are becoming increasingly more interested in understanding their Scope 3 emissions risks to determine what options they may have.
This begins with obtaining accurate measurements. However, this is easier said than done for several reasons.
Firstly, precise reporting is difficult. Emission calculations are often reported over or under by as much as 50%. “The measurement, target-setting, and management of Scope 3 is a mess,” said Anant Sundaram, a finance professor at Dartmouth College’s Tuck School of Business. “There is a wide range of uncertainty in Scope 3 emissions measurement… to the point that numbers can be absurdly off.”
Secondly, it doesn’t appear that a Life Cycle Analysis (LCA) is enough. Per the Organization for Economic Development: there is no single LCA method that is universally agreed upon. Different boundary definitions will produce very different results, and there is a lack of comprehensive data for LCAs. This means there would be reliance on questionable assumptions and databases. In many cases, the cost of the LCA data available is at too high of a level to enable large brands to make actionable decisions on specific products.
So, what are some attributes of reliable carbon benchmarking for participants in the pulp & paper value chain?
- Modeling is consistently applied.
- The model is based on the fundamentals of pulping and papermaking: a mill’s assets and process (no individual mill ever runs the same year-to-year).
- Modeling enables segmentation by product and company and considers various supply chain configurations.
Fisher’s Unique Approach
At Fisher, we have solved this problem by applying sophisticated analytics to our comprehensive datasets that describe every pulp and paper mill in the world. By taking a systematic approach and basing our models on fundamentals, we can correct the issues found in much of the carbon emissions reporting and provide an “apples-to-apples” comparison for consumers.
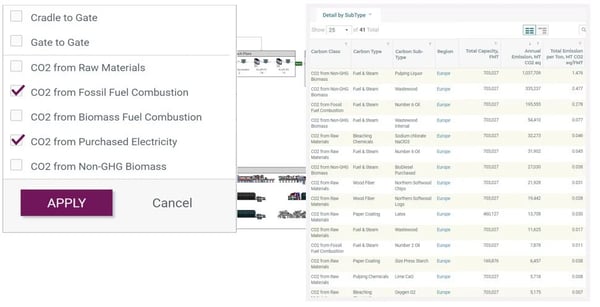
FisherSolve’s Carbon Benchmarking Module starts with a fundamental view of a mill’s capacity, grade mix, and process flows’ given constraints. Once a carbon benchmark is built from the primary principles, methodology is applied consistently to all paper machines in the database. By linking mill and asset data together, it enables us to understand the “why” of it all.
Buyers of pulp, paper and resulting converted products are increasingly seeking reliable carbon data to incorporate into their strategic planning and decision-making in compliance with related legislation. Based on our discussions with end-users, existing datasets are often insufficient. They are not granular enough and lack the direct comparison that is needed.
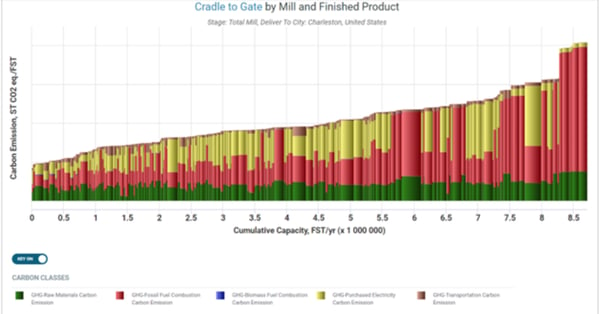
FisherSolve’s carbon and cost models are used by stakeholders to address these issues, and we’re seeing an increase in demand for the data. We offer information on the carbon footprint of every pulp line and paper machine for each of the products they produce. This goes all the way from cradle to destination. This allows companies to have more information than ever at their fingertips to ensure their procurement practices match legislative requirements in addition to corporate visions.
Contact us today to learn more and to schedule a demo to see how FisherSolve can help you.