US forest industry performance in September and October was recently reported by both the US government and the Institute for Supply Management.
Total industrial production (IP) fell 0.6 percent in September (-7.3 percent YoY), its first (and unexpected) decline after four consecutive monthly advances. For 3Q as a whole, the index increased at an annual rate of 39.8 percent. Despite recovering more than half of its February-to-April decline, the September total IP reading was still 7.1 percent below its pre-pandemic February level.
Although manufacturing output (which comprises three-fourths of total IP) rocketed up by an annualized rate of 53.7 percent in 3Q, activity in that sector decreased 0.3 percent in September and was 6.4 percent below February’s level. Concurrent output of utilities dropped 5.6 percent, as demand for air conditioning dwindled. Mining production (mostly oil extraction) increased 1.7 percent (but -14.8 percent YoY).
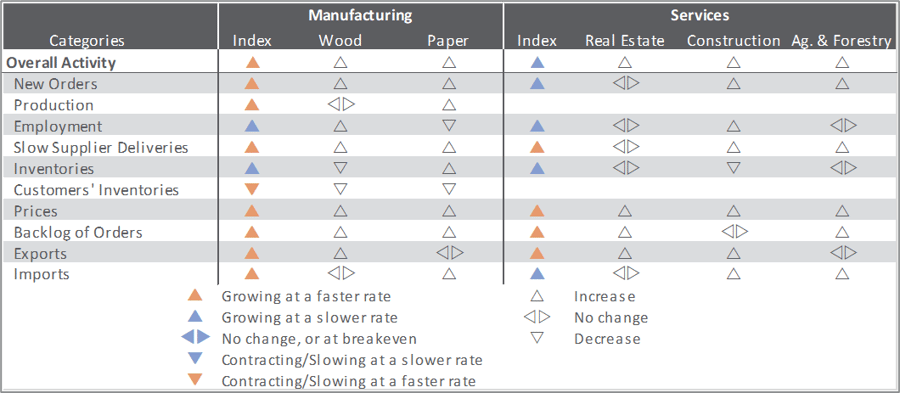
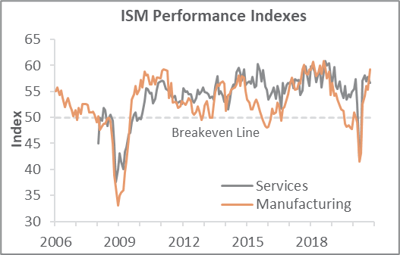
The Institute for Supply Management’s (ISM) survey showed US manufacturing expanding more quickly during October. The PMI registered 59.3 percent, up 3.9PP from the September reading. (50 percent is the breakpoint between contraction and expansion.) The sub-indexes reflected that faster growth, including “too-low” customer inventories (-1.2PP), and slowing supplier deliveries (+1.5PP) typical of an improving economy and increasing customer demand.
The services sector expanded at a somewhat slower rate (-1.2PP, to 56.6 percent). The most noteworthy changes in the services PMI (formerly known as NMI) sub-indexes included a greater prevalence of businesses paying higher input prices (+4.9PP), and a jump in order backlogs (+4.3PP). All of the industries we track expanded. Comments from respondents included:
- Construction: “Interesting business cycle: Labor is still in short supply, and work orders are picking up.”
- Paper Products: “October order books are the strongest we have seen in the past six months.”
- Furniture & Related Products: “Construction materials have leveled off but continue to be at an all-time high. Mills for board sheet stock have pushed out lead times citing increasing backlogs related to the pandemic and increased supply in the housing market.”
Findings of IHS Markit’s October survey results were more upbeat than their ISM counterparts—including manufacturing’s PMI improving to its highest reading since January 2019, and services business activity expanding at its fastest pace since April 2015.
The consumer price index (CPI) increased 0.2 percent in September (+1.4 percent YoY), led by another sharp rise (+6.7 percent MoM) in the index for used cars and trucks. An 0.8 percent advance in the energy index also contributed to the headline, due mainly to a 4.2 percent hop in the index for natural gas.
Meanwhile, the producer price index (PPI) advanced 0.4 percent MoM (also +0.4 percent YoY). Traveler accommodation services led the 0.4 percent increase in the index for final demand services, although a variety of other services also contributed. Prices for final demand goods also moved up 0.4 percent, primarily the result of a 14.7 percent jump in prices for iron and steel scrap.
“Producer prices continued on their path towards normalization in September, with the [YoY change] moving out of deflationary territory for the first time since March,” wrote Oxford Economics’ Mahir Rasheed. “Looking ahead, a soft demand outlook as the economy muddles through the Covid-19 crisis will keep a lid on price pressures.”
In the forest products sector, index performance included:
- Pulp, Paper & Allied Products: +0.7 percent (+1.4 percent YoY)
- Lumber & Wood Products: +8.4 percent (+20.1 percent YoY)
- Softwood Lumber: +27.4 percent (+81.2 percent YoY)
- Wood Fiber: +1.0 percent (-0.6 percent YoY)