The COVID-19 pandemic has raised countless questions and provided very few answers about the future of the pulp and paper industry.
In an effort to lift some of the fog and uncertainty, Fisher International has launched a free interactive map that outlines the potential impacts of coronavirus on demand and uncovers the percentage of production capacity and machines in danger of not making it through an economic downturn caused by the pandemic.
“We want to help those in the paper industry get some sense of the impact to the industry from disruptive events, and in this case, coronavirus,” said Clay Enos, Fisher International’s director of business intelligence. “We feel this interactive map is a nice way to present that information. It doesn’t display every factor or variable that goes into our calculations, but we’d be more than happy to discuss our process with interested customers.”
This map uses deep, comprehensive data from FisherSolve™ Next, predicative demand models, and government COVID-19 data to deliver the following data points:
Country Capacity
Though FisherSolve™Next can break down production capacity into individual mills, grades, and machines, this map utilizes total country capacity of all products.
For a quick illustration of production percentages, below is a graph of the top countries by production and their percentage of global products.
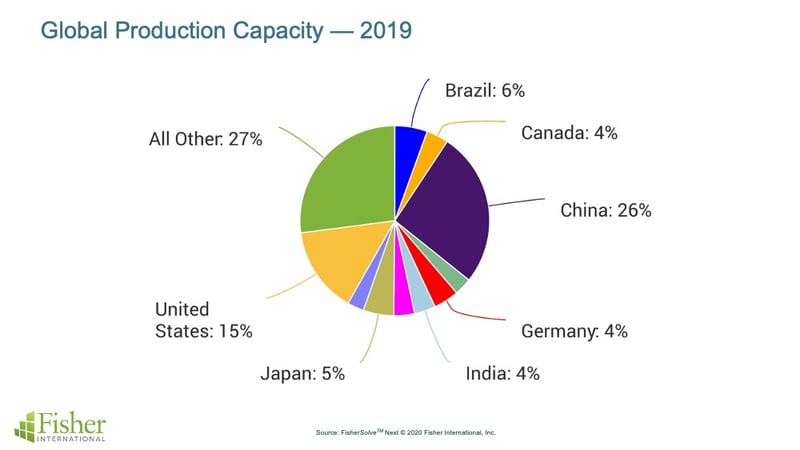
Fisher's interactive map includes data on those 10 countries and several other major players in the pulp and paper industry who will feel the effects from this pandemic.
Estimated Demand Change
For producers, the 800-pound gorilla in the room is the lingering question of how much product will be enough (or far too much) in the coming years.
In the short term, we’ll likely continue to see a spike in demand for consumer tissue and packaging while a large portion of the world’s workforce remains at home using their own bathrooms and keeping Amazon busy. As for printing and writing papers, well, its demand situation has only gotten more dire.
This calculation uses a predictive demand model which considers several factors including (but not limited to) GDP growth, FisherSolve™ Next data, population trends, and expert insight on specific grades to build a forecast comparing Q42019 demand to expected Q4 demand for the next five years.
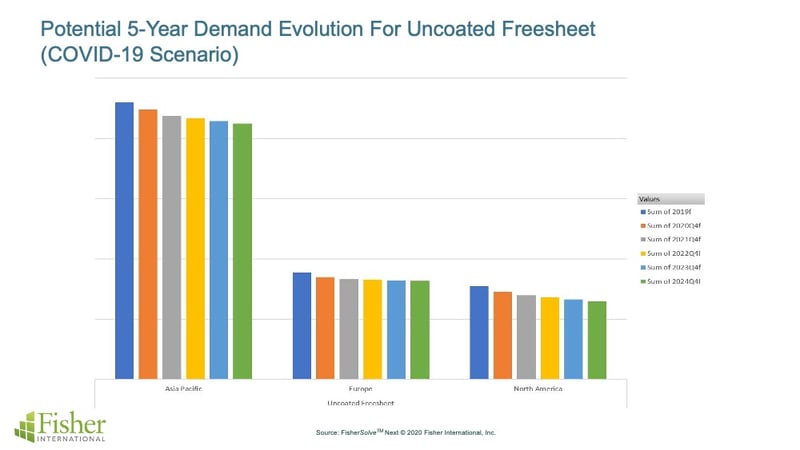
“Even though the future is uncertain, and we don’t yet know what the impact will be, we can run scenario analyses and get reasonable boundaries.” Enos said. “If you have the access to the underlying data in FisherSolve™ Next, we can break down this model by product.”
Percentage of Total Capacity at Risk
For more than 15 years, Fisher International has studied all pulp and paper industry line and mill closures, company bankruptcies, and the reasons leading to those closures. Each instance has been analyzed by Fisher experts and each instance influences analysis models.
Data in FisherSolve™ Next includes the unique assets, location and input costs for every mill in the world.
From this data, a matrix is created to analyze how any mill in the world ranks against other mills producing similar products. This matrix is called "FisherSolve™ Viability Benchmarking."
Depending on this ranking, a mill can be rated “low risk” or “high risk” or anything in between.
“Risk represents the likelihood a mill or machine line will survive the next down business cycle. It’s quite likely coronavirus will cause that type of downturn,” Enos said. “We ask which of these factors are most indicative of a mill’s likelihood to close, based on historical analysis, and we use that to forecast forward and determine which mills have the best and worst traits.”
Mills or machines are placed on the matrix based on variations in productivity determined by their asset size, age, speed, and automation level.
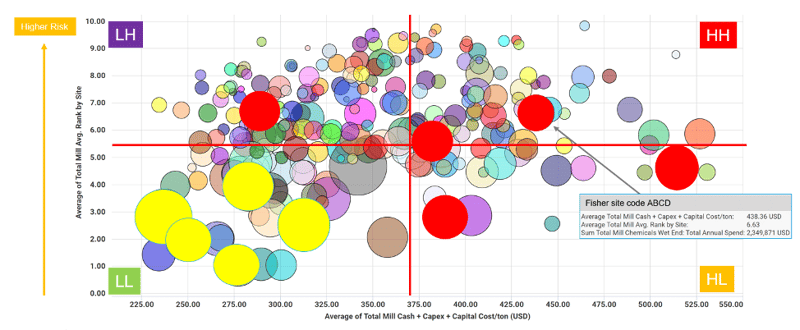 Each quadrant can be read as follows:
- LL = Low cost/low risk
- HL = High cost/low risk
- LH = Low cost/high risk
- HH = High cost/high risk
This data is adjusted quarterly for all mills. Relative mill ranking changes if any input data changes, cost of electricity changes, if the mill recently invested into a new machinery, etc.
Percentage of Total Machines at Risk
Unique from the “Total Capacity at Risk” calculation, this figure is a count of machines labelled high-risk based on their age, product grade, etc.
“This is interesting because you can get a sense for the scale of the machines actually making the products likely to feel the effects of this pandemic,” Enos said. “In Austria, for example, 32 percent of its machines are considered high-risk, but those machines produce 13 percent of the total capacity, which tells you they must be smaller machines.”
For more information about this map and how Fisher International can help you prepare for the future, fill out the form on the “Contact Us” page.